How we test graphics cards at TechRadar
How I test GPUs for my reviews
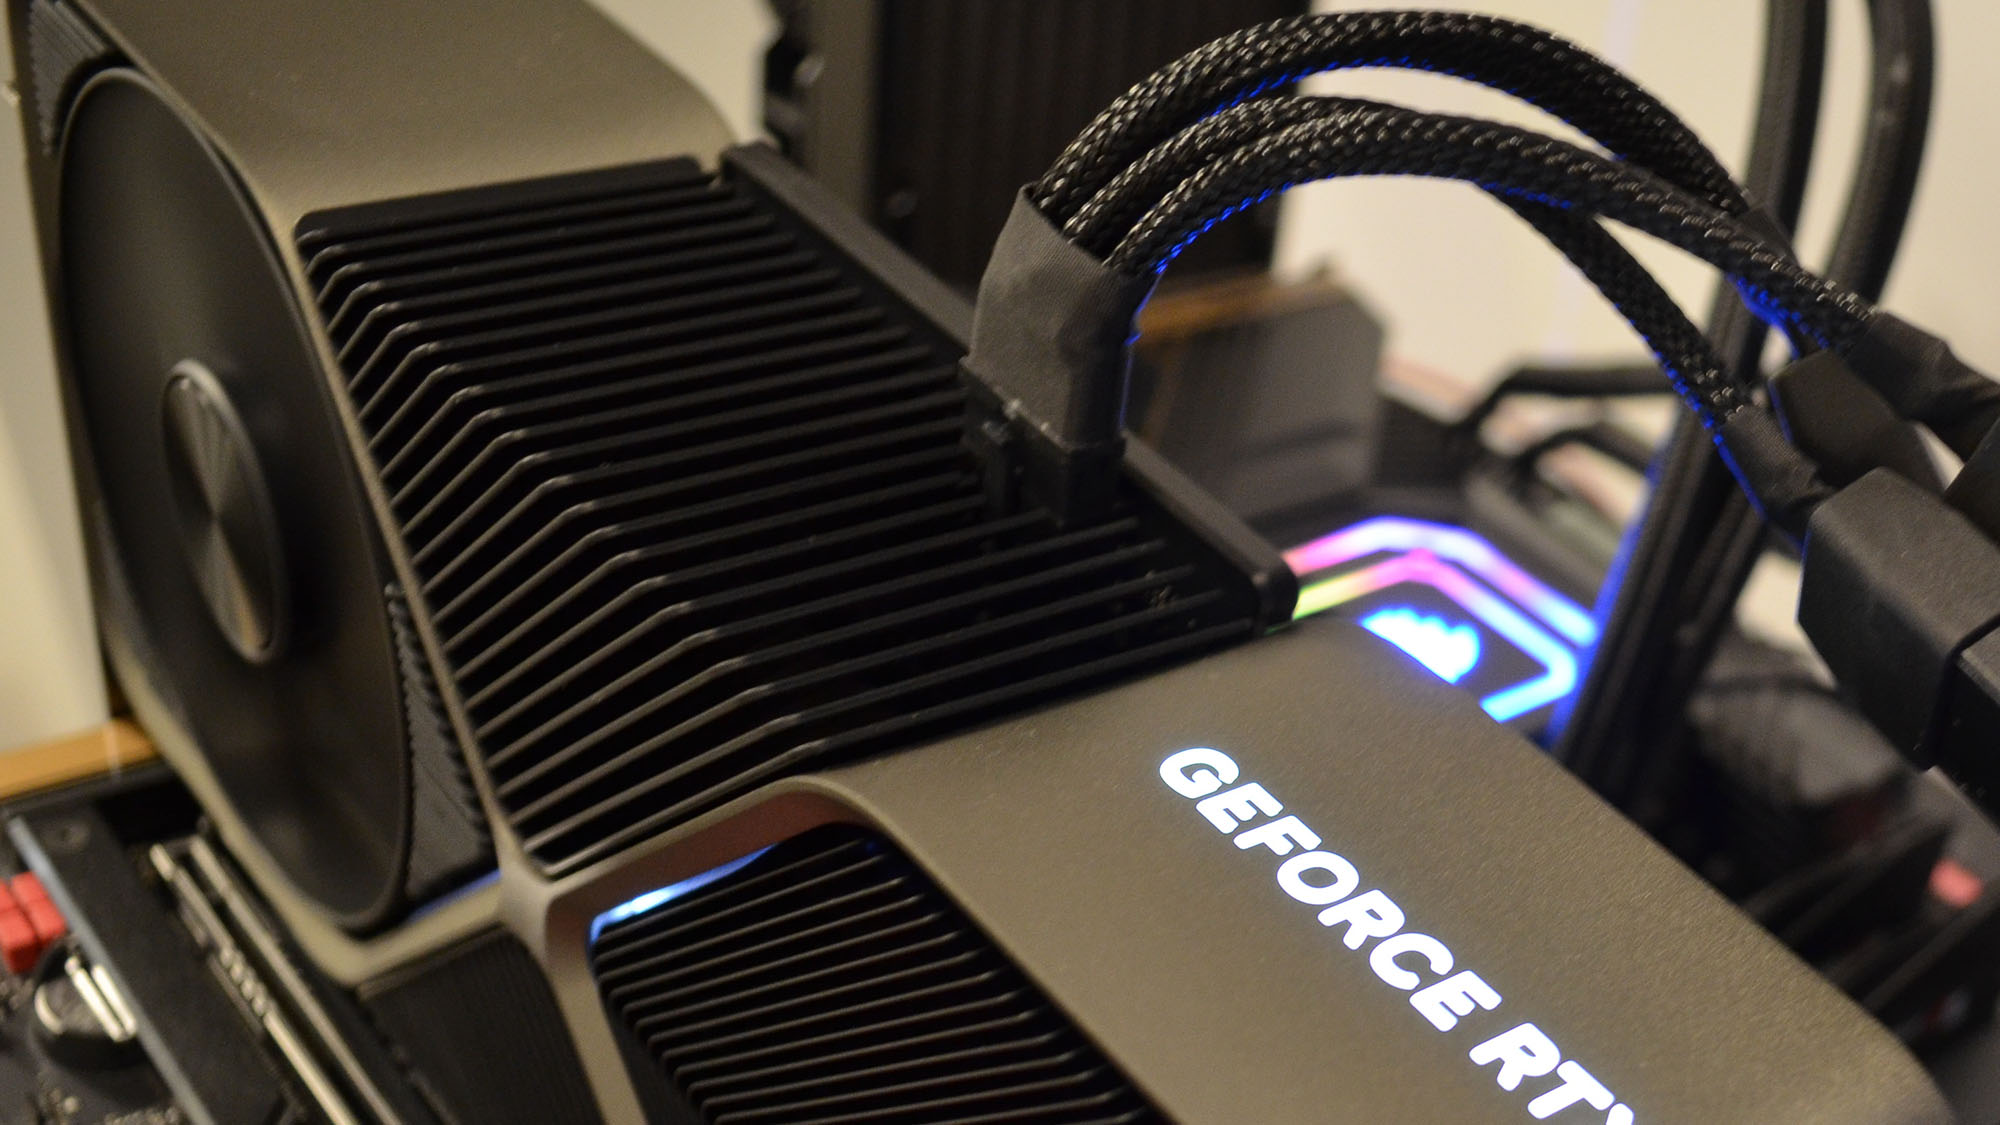
An essential part of any good graphics card review is extensive benchmark testing, and TechRadar has always taken this process very seriously.
But just because I know the ins and outs of my graphics card testing process doesn’t necessarily mean that you do, and a huge part of why you can trust my graphics card reviews is the hundreds of hours I’ve put into GPU testing over the past few years reviewing the best graphics cards.
To help make this process more transparent for readers to understand, I’m here to give a detailed breakdown of the various tests I run for graphics card reviews, why I use them, why they’re relevant for a given user, and how these various tests factor into my final assessment of a graphics card for a review.
How I test a graphics card
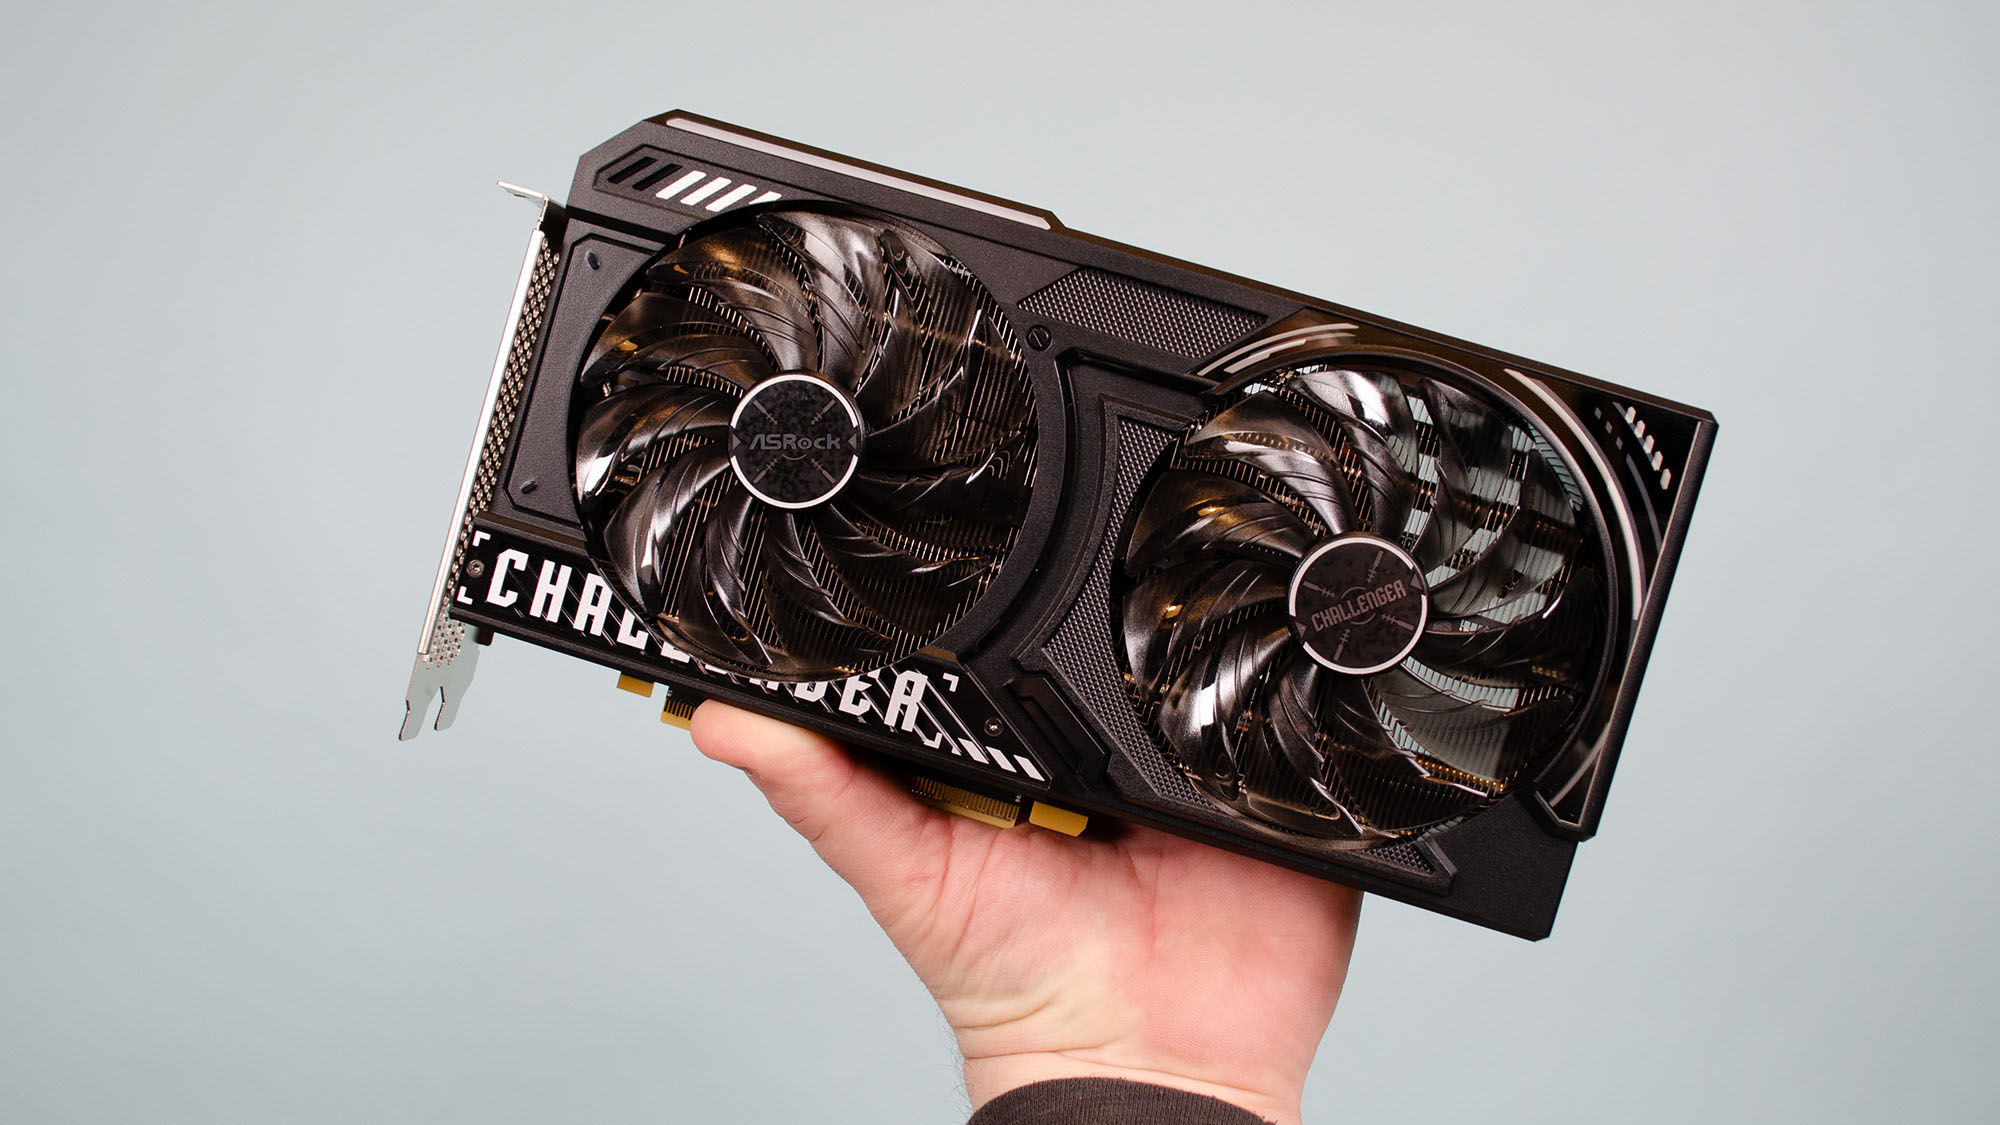
There are two essential parts of any good testing process: objective results and repeatability.
The former means that the result of a benchmark run returns a numerical value that can be compared to similar benchmarks on different graphics cards. This can either be a score, a raw value like frames per second, or a duration as a measure of how long it took a test to finish.
Generally, I prefer to convert scores wherever possible into an absolute number where the higher the number, the better the performance, just to make things easier for the reader and to help ensure that I can calculate an average score after finishing my tests that aren’t distorted by mismatched metrics.
The second foundation of my testing is that benchmarks need to be as close to identical between different graphics cards under examination as possible. For that reason, I only use benchmark tools that use some form of automated run or script that performs identical tasks using a graphics card without any input from me. This eliminates any variability between tests that might favor one card over the other.
Get daily insight, inspiration and deals in your inbox
Sign up for breaking news, reviews, opinion, top tech deals, and more.
I also account for natural variance between test runs by running each test more than once. If I run a test twice and there is a less than ~2% difference between the results, I use the higher of the two results as the score for that test. If the difference in results is greater than ~2% after two tests, I run the test a third time and take the average of the three results as the score for that test.
How I setup my test system
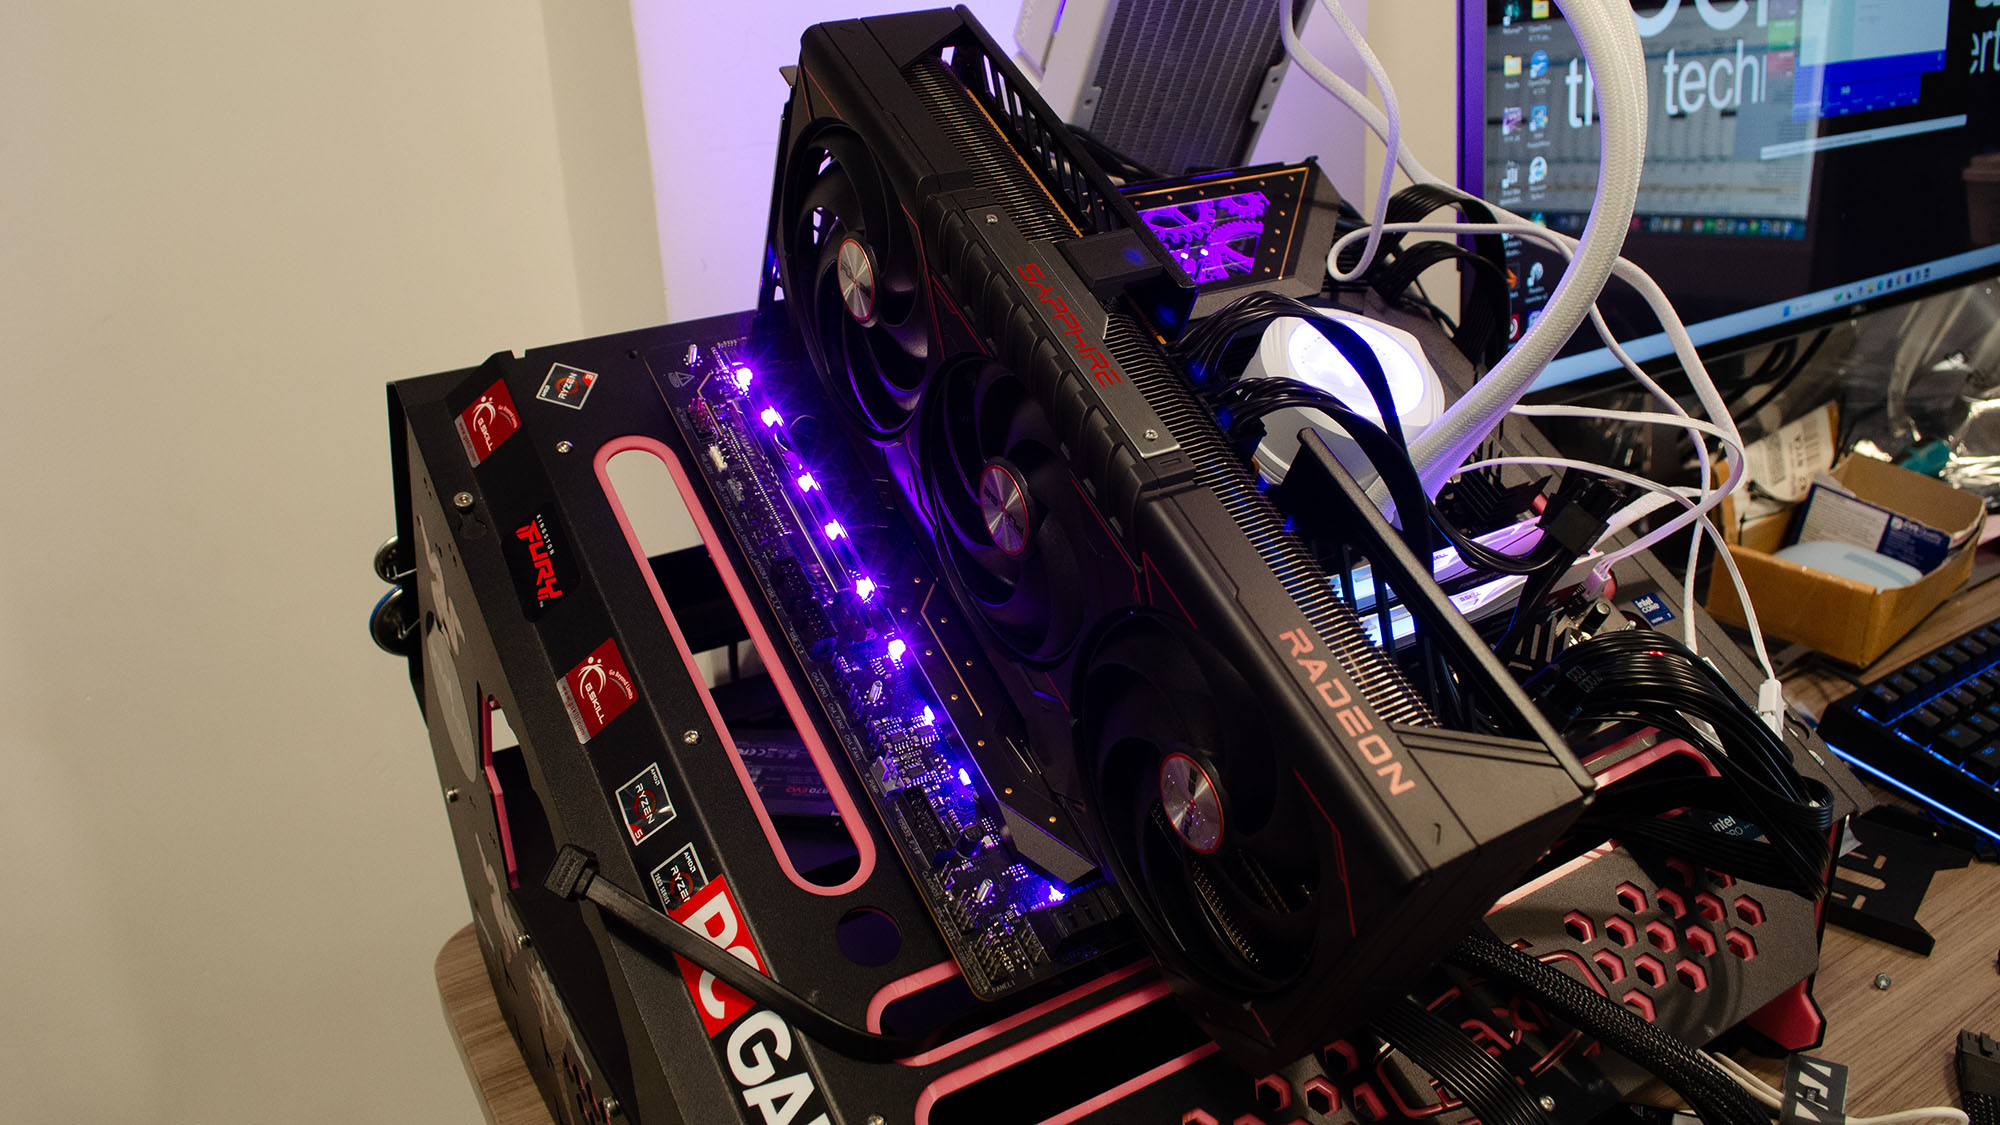
It’s essential to isolate the performance of the GPU versus the contributions of other components like the CPU, RAM, or storage device used during testing. To accomplish this, I use the best processor, the best RAM, and the best SSD available to me on the best motherboard I have in the lab with sufficient CPU cooling to keep the system performance from throttling due to heat buildup.
Using the best component mix possible ensures that any performance bottlenecks from other components that can impact a benchmark’s score are minimized, if not eliminated.
I make sure to use this same system setup for all the various graphics cards I test for a review so that differences in scores between graphics cards can be fairly attributed to the quality of the graphics card itself and not some other component that might be better at running one test than some other component.
I also make sure that every time I review a new graphics card (or retest previously reviewed cards for features or updating our reviews test results), I use the most updated driver from AMD, Intel, or Nvidia and that I make sure to retest cards I’ve already reviewed if I’m using them for comparison to make sure I have the most up-to-date performance results.
How and why I use synthetic benchmark tests

Synthetic benchmarks are tests that run simulated tasks on a graphics card comparable to real-world use, whether that’s GPU compute tasks or rendering 3D sequences using the graphics framework as video games (such as Microsoft DirectX 11 or the cross-platform Vulkan framework).
These simulated tasks are useful in measuring specific GPU performance features like rasterization and ray tracing. Taken together, these tests give insight into the raw performance potential of a graphics card, though these tests alone aren’t enough to determine which graphics card is actually better than another in real-world applications. For that, other application-specific tests are needed.
How and why I use creative benchmark tests

One of the most important components of any creative workstation is the graphics card, as this is where powerful media encoding engines and 3D rendering pipelines can carry out creative tasks like video editing, 3D modeling, and more much faster than even the best CPU alone can do.
Creative professionals and hobbyists alike depend on several common workloads that can be simulated through benchmark tests like PugetBench for Creators, Handbrake, and Blender Benchmark, and so I use all of these to test a graphics card’s relative creative performance.
How and why I use built-in video game benchmarks

The most common reason for using a dedicated graphics card in your PC is for PC gaming, so I focus very heavily on PC gaming benchmarks in my testing. It’s important to test a graphics card with a variety of games, not just the most visually demanding title available, to determine what the typical gamer will experience with a given graphics card.
To do this, I use a suite of about 8-10 current games that include built-in benchmark tools that automatically run through a typical scene from the game, giving the benchmark’s result in an average frames per second figure (FPS) and a minimum or 1% FPS figure.
These represent the average framerate you can expect to experience in that game with a given set of graphical settings as well as the lowest or near lowest (1%) recorded framerate during the test. This latter number represents the framerate ‘floor’, which is a good way to assess what the worst possible gaming experience might be for a given graphics card at a specific set of graphics settings.
I generally run these benchmarks at a graphics card’s target resolution and the next step down, resolution-wise (so 4K and 1440p for cards with 16GB VRAM or greater, and 1440p and 1080p for cards with less than 16GB VRAM), unless specific marketing claims are made about different resolutions or the specs for a graphics card make it theoretically capable of running at higher-than-marketed resolutions.
I test games at a given resolution without upscaling or ray tracing at the highest visual setting preset available, as well as with ray tracing maxed out, with balanced upscaling but no ray tracing, and with both max ray tracing and balanced upscaling, recording both average and minimum/1% FPS.
How I score a graphics card using these tests
For all scoring averages, I make sure to convert any test results into absolute figures where the higher value is better (so for Civilization VII, which reports average and minimum time in milliseconds used to render a frame, rather than FPS, I divide 1000 by the frame time, which gives you the number of frames per second for that run).
To average the different category scores, I take the geometric mean rather than a straight average, since a geomean is much less susceptible to being skewed one way or the other by very large numbers.
I take a straight geomean of synthetic benchmark scores and creative benchmarks to come up with the final synthetic and creative scores. For gaming performance, I take a geomean of all the average FPS scores across settings for a given resolution for the purpose of assessing average performance at those resolutions, but I then take a geomean of those gaming performance scores for the final gaming performance score.
For the final performance score, I take a geomean of the synthetic, creative, and gaming scores.
Finally, I take that final performance score and divide it by the graphics card’s MSRP to come up with a value score for the graphics card.
Why this testing matters
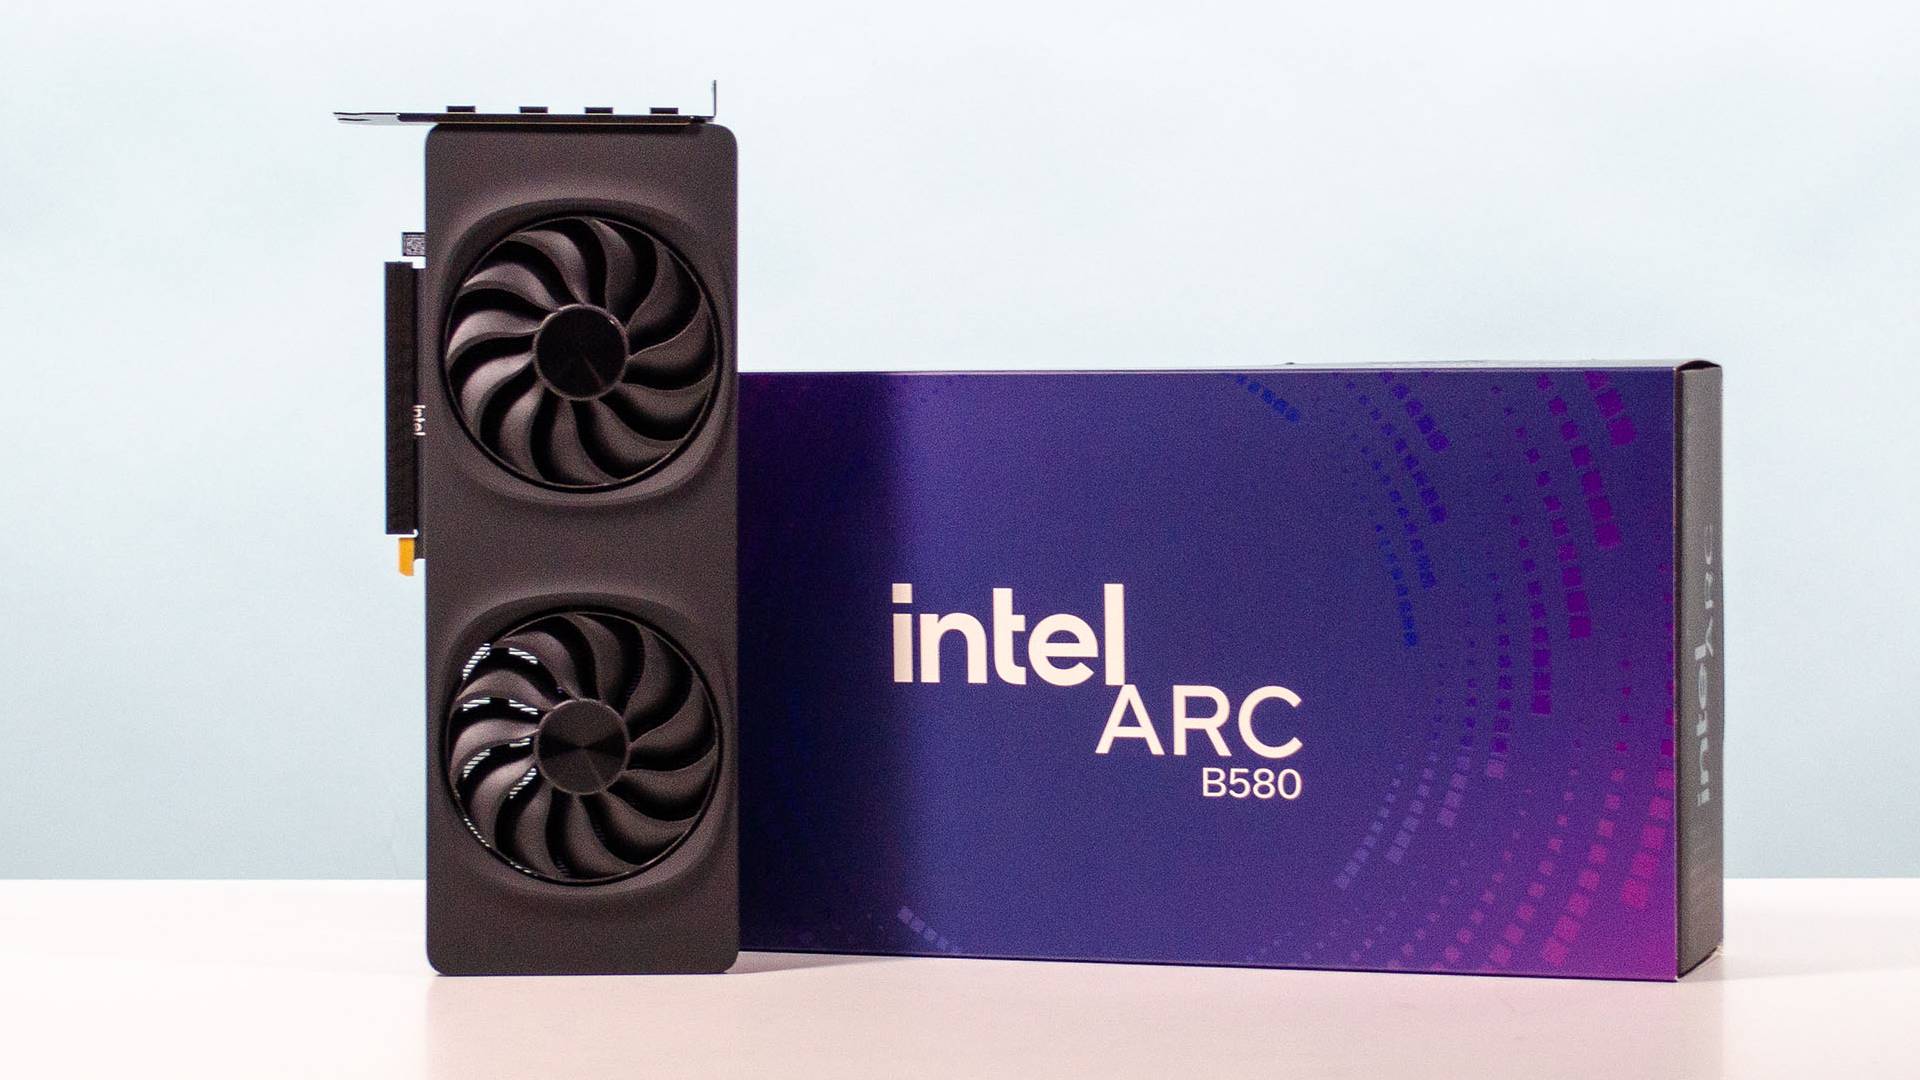
Given how much a graphics card can cost, it’s important to have as much information about its performance as possible before making a purchase, but that data can also be impossible to come by without the kind of extensive testing I do here at TechRadar.
While the numbers I include in my reviews are unlikely to be the same as you might get unless you have the same system configuration as I used in my testing, this testing is more about measuring the relative performance of a graphics card against other options on the market that you might be considering, while also giving you a good approximation of the kind of performance you’d get with it.
As with everything, your mileage with a graphics card may vary, but I spend as much time as I do testing graphics cards to give you the best possible view of a graphics card’s performance to help you make the right decision for your next upgrade.
Read more about how we test products at TechRadar

John (He/Him) is the Components Editor here at TechRadar and he is also a programmer, gamer, activist, and Brooklyn College alum currently living in Brooklyn, NY.
Named by the CTA as a CES 2020 Media Trailblazer for his science and technology reporting, John specializes in all areas of computer science, including industry news, hardware reviews, PC gaming, as well as general science writing and the social impact of the tech industry.
You can find him online on Bluesky @johnloeffler.bsky.social
You must confirm your public display name before commenting
Please logout and then login again, you will then be prompted to enter your display name.