How to visualize complex data on Linux
Simon Quain shows how to visualize Covid-19 statistics and more with freely available open datasets and Timelion, a plugin for Elasticsearch.
Analysis
Now the data is in Elasticsearch, let’s get into creating some Timelion graphs! We can navigate via the hamburger icon again to Visualize>Create New Visualization>Timelion to access the Timelion UI.
To start off with we’re presented with the simplest Timelion expression: .es(*).
This gives us the count of all entries in all of Elasticsearch and the spread of those entries over time. You may need to adjust the time period shown in the graph to see this. You can do that by clicking the calendar icon in the top-right area of the screen and choosing a suitable time period. We’d suggest “Last 90 days”.
Perhaps you have other data in other indexes. We want to make sure we’re only using the covid index so we can set that explicitly with .es(index=covid). After clicking Update (or pressing Ctrl+Enter) we should only see Covid-related data.
Let’s try to display the number of new cases over time. To do this we can use the metric argument. This is set in the format metric=METRIC_TYPE:FIELD_NAME where METRIC_TYPE can be one of avg, sum, min, max and so on, and the FIELD_NAME is the field to calculate the metric for.

So for cases over time, we can enter .es(index=covid, metric=sum:cases).
Note this isn’t the total sum of cases for the time period. Timelion will split up the total time period selected into intervals or buckets of time and calculate the sum for each bucket. By default, the interval between each data point is set to Auto so you may notice that the graph has lots of spiky peaks and troughs.
Are you a pro? Subscribe to our newsletter
Sign up to the TechRadar Pro newsletter to get all the top news, opinion, features and guidance your business needs to succeed!
As our data is figures per day, we can set the interval to “1 day” in the drop-down above the expression box to achieve a smoother graph.
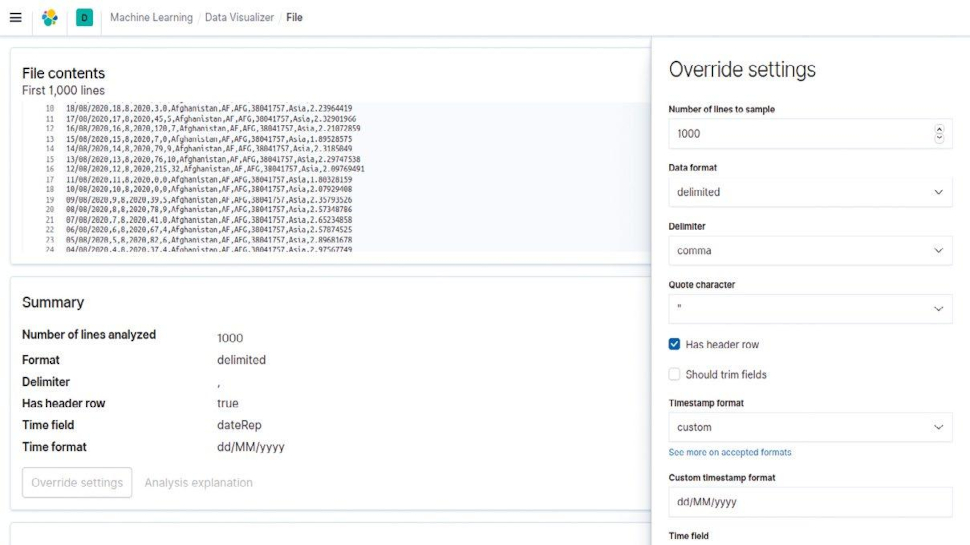
If you didn’t change the time field to be timestamp, you can add, timefield=dateRep inside the parentheses to tell Timelion to obtain the date from there.
We can also run Elasticsearch queries inside of Timelion. If you were in the Discover pane on Kibana and wanted to limit the data to just that for the United Kingdom, you’d enter countriesAndTerritories: United_Kingdom in the search bar.
You can set this in Timelion too by using query or shorten it to q as in the following example:
.es(index=covid, q="countriesAndTerritories:United_Kingdom”, metric=sum:cases)
Timelion expressions are chainable. If we wanted instead the cumulative sum of cases for the time period selected, we could write
.es(index=covid, q="countriesAndTerritories:United_Kingdom”, metric=sum:cases).cusum()
Note again that this sets the initial value of cases to zero for the start of the period chosen and counts upwards from there to the end of the time period. Therefore this may not be the cumulative sum of all cases in your dataset for your chosen query.