How to report problems in Windows 10
Check performance issues and record what's going wrong step-by-step
ETW trace
If you need to share more technical details about what's going on, record an Event Tracing for Windows (ETW) trace. This includes what's happening in memory and on disk and will help developers track down bugs (or tell you that you have a hardware problem, like your CPU overheating).
You can install the free Windows Performance Toolkit and use the Windows Performance Recorder to record system performance (using event tracing) and the Windows Performance Analyser to look at the performance, but an easier way to use ETW is with the UIforETW tool (written by Google's Bruce Dawson).
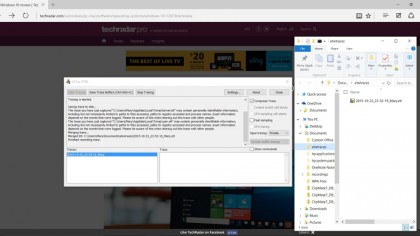
Grab this from here and it will install the Windows Performance Toolkit for you as well. Download the etwpackage.zip file, extract it to a folder and run the etwpackage/bin/UIforETW.exe file, then choose Start Tracing.

This records all your activity – what process and thread generated an event, how it used the CPU and so on – and saves the last ten to sixty seconds into a file, so you can leave it running until the problem occurs, then press Ctrl-Windows-C to save the file.
Fill in the Trace information field with as much information as you have about what you were doing and how the problem happened. Right-click on the list of traces in the USER INTERFACE for ETW window and choose Browse folder – that opens the ETWtraces folder in your Documents folder where all the traces are saved.
For each trace you've saved by hitting Ctrl-Windows-C, there will be a pair of files – one ETL file and one TXT file. Mail them both with your bug report, or upload them to a file sharing service and include the link in your bug report.
ETW files do include some information that might be personal, like the files being written and read from – so if you're editing a document or playing music, the name of the document file or the music file might be included (but not the contents).
Are you a pro? Subscribe to our newsletter
Sign up to the TechRadar Pro newsletter to get all the top news, opinion, features and guidance your business needs to succeed!
The Full mode of tracing records more details than Private mode, which changes the numbers and letters you type (they will all be 1s and As to avoid including what you actually type). But the ETW trace will always have details of your hardware, and the version numbers of the software you have running when you record a trace.

If you want to include a lot more details about your CPU hardware – like the frequencies, power draw and temperature – install the Intel Power Gadget and run it before you start your trace.
You can also turn on an option to trace some Chrome events with Event Tracing for Windows: navigate to chrome://flags/, scroll down to "trace-export" and turn on Enable exporting of tracing events to ETW. Close and relaunch Chrome and you can pick various categories to trace, like the Blink engine's GPU use. Chrome traces are very likely to include the URLs of open tabs, so close any tabs you don't want to have recorded before capturing your trace.
Mary (Twitter, Google+, website) started her career at Future Publishing, saw the AOL meltdown first hand the first time around when she ran the AOL UK computing channel, and she's been a freelance tech writer for over a decade. She's used every version of Windows and Office released, and every smartphone too, but she's still looking for the perfect tablet. Yes, she really does have USB earrings.