Android phones lose their value twice as fast as iPhones, claims report
HTC, the biggest loser

A 'Mobile Phone Value Depreciation Report' is out. And among its many interesting findings is the comparison between Android and Apple phones.
In 24 months, flagship Android devices have depreciated double the rate of iPhones.
But after four years, the gap closes a little, with iPhones losing an average of -66.43% of their initial buyback value, compared with Androids -81.11%.
On an average, Android devices with launch prices of $350 or under lose half their trade-in value in just one year. Owners of popular budget smartphone brands like Samsung, Motorola, LG, HTC, and Google lost an average of -52.61% of their trade-in value in 2019-2020.
- Best phones under Rs 25,000 in India for 2020
- Best phones under Rs 15,000 in India for 2020
- Best camera phones under Rs 20,000 in India for 2020
The report and its methodology
These findings emerged through the trade-in site BankMyCell, which tracked 310 device resale values from multiple vendors, hourly.
The report finds out which smartphones are most likely to bleed resale value by brand, model, and operating system. It can be handy knowledge for consumers looking to leverage the value of their old device in an upgrade.
The report said 9 months after the Samsung Galaxy S20 Ultra release, the buyback price was -64.71% of its original retail value. By comparison, in the same nine-month timespan from release, the iPhone 11 Pro Max had lost -32.22% from its original retail value.
Get daily insight, inspiration and deals in your inbox
Sign up for breaking news, reviews, opinion, top tech deals, and more.
But it wasn’t all smooth sailing for Apple, the iPhone SE 2020 did not follow the -16.70% average decline in year one. Like the trends budget Android devices, the iPhone SE 2020 lost an average of -38.32% of its resale price eight months.

Budget Android devices retailing for $350 or less will lose an average of -52.61% of their resale value in year one, -73.61% year two, -85.15% year three, and -94.90% by year four.
One popular example, the Samsung A50 lost -79.94% of its trade-in value from March 2019 to December 2020. Another example is the Motorola G7 range, which lost up to -79.17% of their trade-in value in 9 months in 2019, then a further -61.97% between Jan-Dec 2020.
Google Pixel phones slipped by an average of 40.17% in a year
The report said that consumers who owned one of the top 10 most traded-in Google Pixel phones in 2020 lost an average of -40.17% of the device’s value in 12 months.
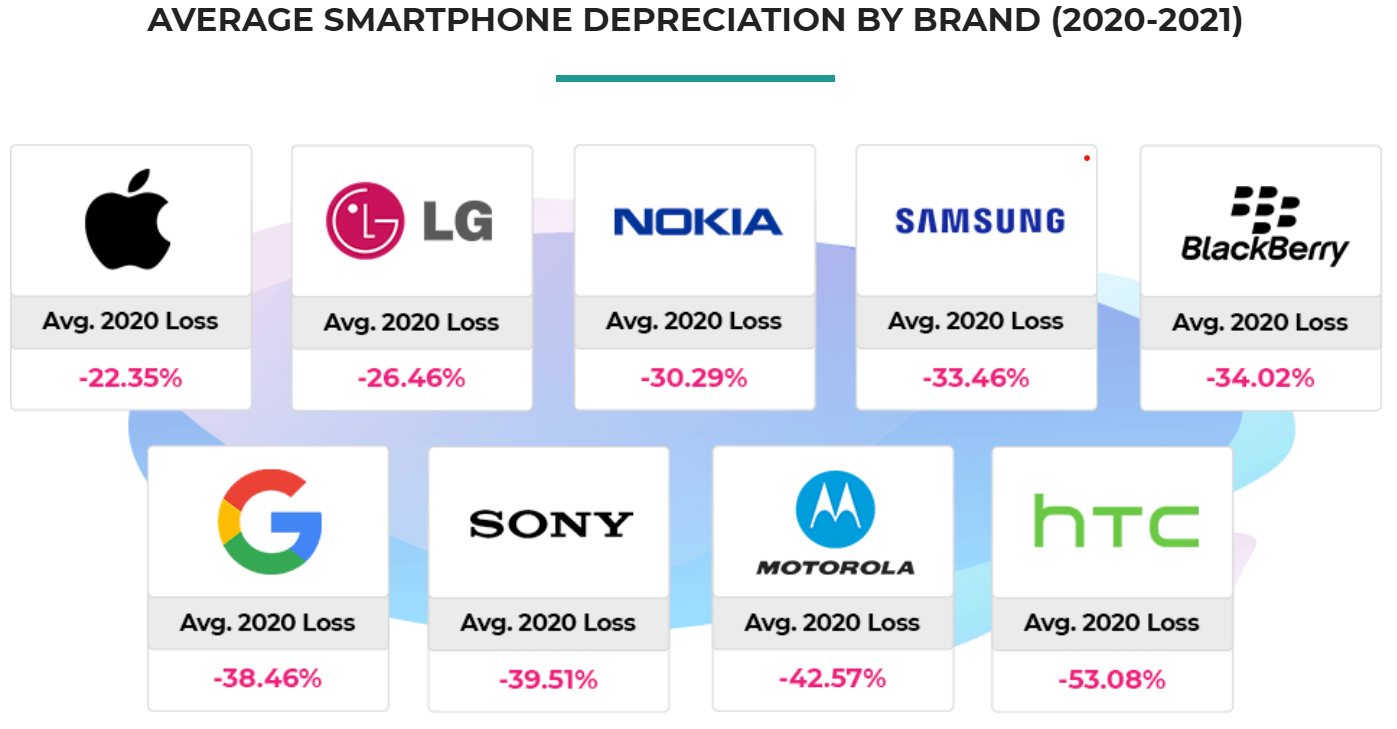
In 2020, the average trade-in depreciation of all Google Pixel phones was -38.46% across all models and storage sizes. Google’s Pixel 4 & 4 XL devices lost $154-$163, which is considerable with their initial trade-in values ranging between $380 to $490 in Jan 2020 As well as making the overall highest value loss list, 2019’s Google Pixel 4 & 4 XL made the top 10 highest depreciation list too, -40.06% Pixel 4, -34.64% Pixel 4 XL.
HTC depreciated the most

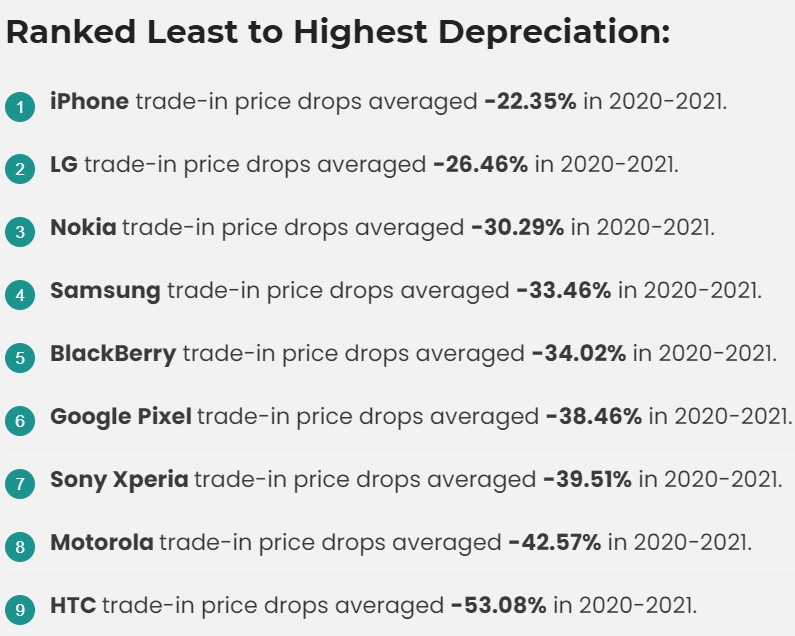
The report tracked depreciation across nine popular phone brands to see which lost the most in 2020.
HTC smartphone trade-in prices depreciated -53.08% on average between Jan – Dec 2020. The HTC U11 Life (2017) was the highest, depreciating at -81.82%.
Motorola smartphone trade-in prices depreciated -42.57% on average between Jan – Dec 2020. The Motorola G7 (2019) was the highest, depreciating at -61.97%.
Sony smartphone trade-in prices depreciated -39.51% on average between Jan – Dec 2020. The Sony Xperia XA2 (2018) was the highest, depreciating at -72.22%

Over three decades as a journalist covering current affairs, politics, sports and now technology. Former Editor of News Today, writer of humour columns across publications and a hardcore cricket and cinema enthusiast. He writes about technology trends and suggest movies and shows to watch on OTT platforms.