Get your graph on with Google's new search feature
Maths fans rejoice

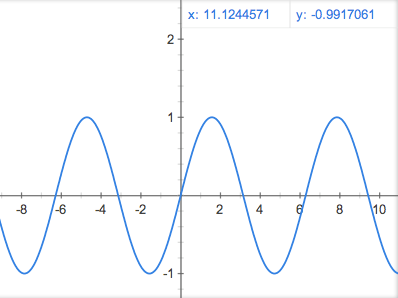
Google has announced that from today users can plot graphs of complicated functions simply by bashing them straight into the Google search box.
Announced on its official blog, Google is hoping the new maths functionality will bring the "magic" back to making graphs.
So far, so good, maths fans. Admittedly, it is a little specialised and not exactly something we've been crying out for.
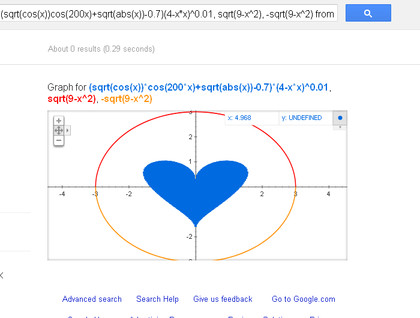
However, if you're not using it strictly for maths purposes you could follow The Verge user chasingtheflow's example and try entering this charming function: (sqrt(cos(x))cos(200x)+sqrt(abs(x))-0.7)(4-x*x)^0.01, sqrt(9-x^2), -sqrt(9-x^2) from -4.5 to 4.5.
This produces a lovely heart-shaped graph.

Google Engineer Adi Avidor explains in more detail, saying "you can zoom in and out and pan across the plane to explore the function in more detail.
You can also draw multiple functions by separating them with commas. This feature covers an extensive range of single variable functions including trigonometric, exponential, logarithmic and their compositions, and is available in modern browsers."
Get daily insight, inspiration and deals in your inbox
Sign up for breaking news, reviews, opinion, top tech deals, and more.
Apart from novelty graphs, it also means that we're one step closer to being able to do absolutely anything by just typing it in the Google search box.
The list of handy things you can do is growing every day. For example you can use it as a calculator, currency and unit converter, track flights and packages, check the time in Tasmania and much more.
For the full list of things you can do from the Google search bar, check out Google's search features page.