Camera testing resolution charts explained
What our resolution charts mean, and how to read them

Resolution Chart
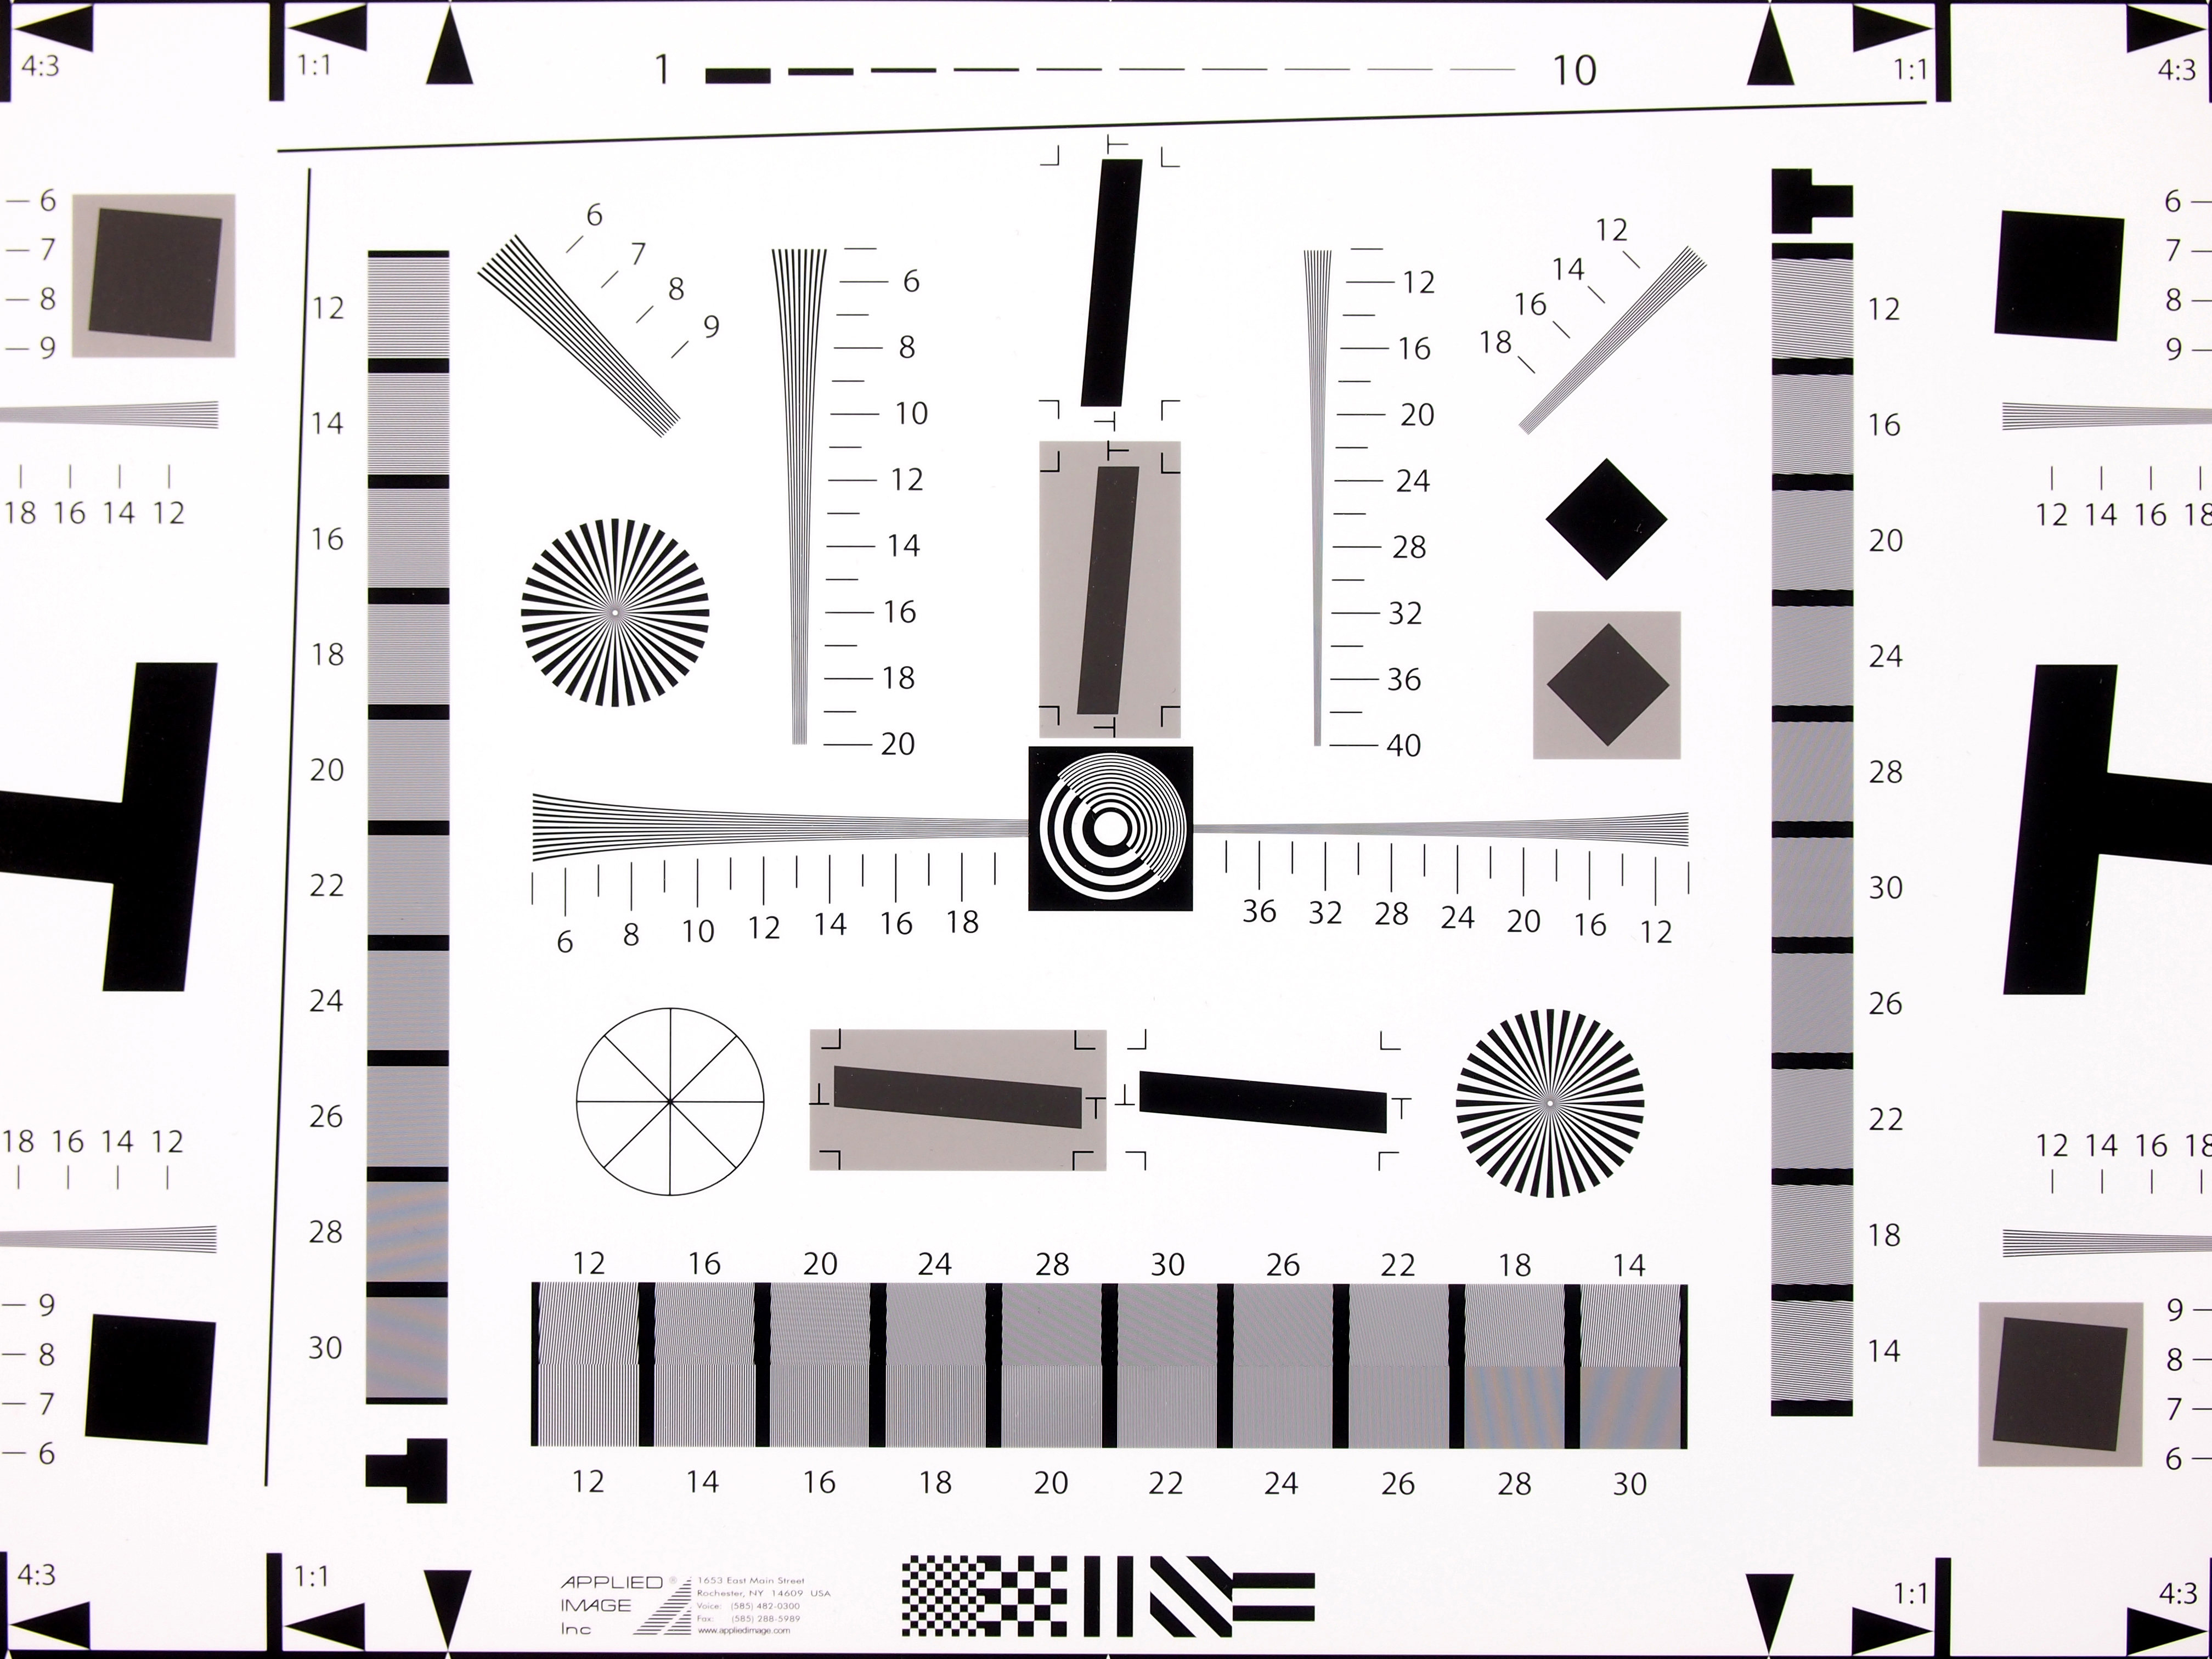
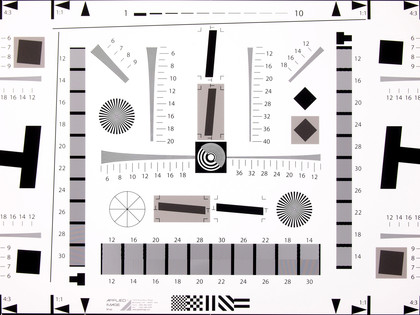
We use our resolution chart to help assess a camera's ability to resolve detail.
We shoot the chart at every sensitivity (ISO) setting and examine the images closely on the computer screen. We show a cropped section of the images in our reviews, but the full images can be downloaded via the hyperlinks.


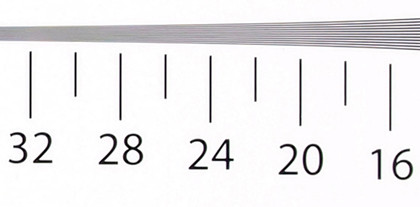
In the above example from the Olympus E-P3 the score would read 24 (see full image)
The cropped section shows the part of the chart that tests the camera's vertical resolution (ability to see fine detail) at the centre of the frame. The figures in the image captions give a measure of the camera's performance in line widths per picture height x100. The higher the value, the better the detail resolution and the better the camera's performance.
Images are primarily assessed at 100% on the computer screen, but it may be necessary to zoom in and out to determine the resolution limit properly.
With some cameras the resolution limit is the point beyond which the lines merge into each other to form a broad grey strip. Sometimes it may not be immediately apparent that two or more of the lines have merged, giving the appearance of detail even though a little has been lost. With other cameras interference patterns develop when the resolution limit is exceeded and these obscure the resolution lines.
Our resolution chart is based upon ISO-12233 and is supplied by Applied Image Inc. This chart is suitable for use with a variety of digital camera formats including full-frame, APS-C, Four Thirds and Micro Four Thirds.
Get daily insight, inspiration and deals in your inbox
Sign up for breaking news, reviews, opinion, top tech deals, and more.
Lenses
Where possible (and unless stated otherwise) we use the Sigma 50mm f/1.4 EX DG HSM with the appropriate mount on the camera to minimise variables and ensure that images from different cameras are comparable.
Ali Jennings is the imaging lab manager for Future Publishing's Photography portfolio. Using Imatest Master and DxO Analyser he produces the image quality tests for all new cameras and lenses review in TechRadar's cameras channel. Ali has been shooting digital since the early nineties and joined Future's Photography portfolio back in 2003.