How to get answers from your data with Power BI
Type in a question, get a handy chart
Microsoft has been adding the promised new features to the preview of its cloud business intelligence service, Power BI, which runs in SharePoint Online on Office 365 and works with new BI tools in Excel 2013 like Power Query and Power Map.
You can share not just spreadsheets but the analysis you do of your data with partners and colleagues, so they can see how you arrived at your conclusion and experiment with your analysis.
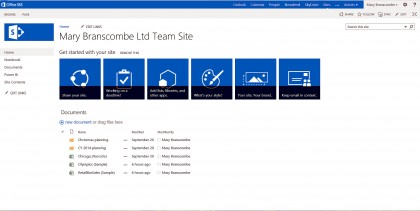
At first glance, Power BI looks like any other SharePoint 2013 system, with the usual list of documents, but you'll find a new app inside each SharePoint site labelled 'Power BI' and after the first time you use this it appears in the navigation list too.
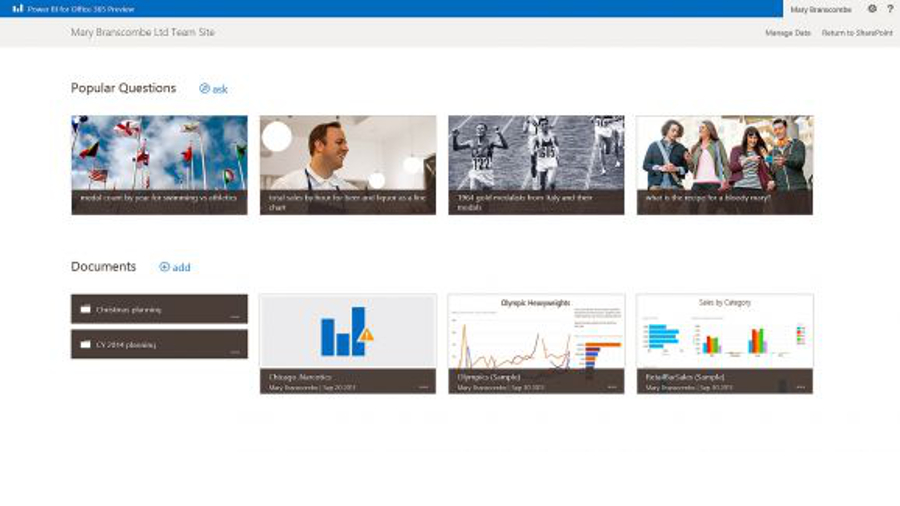
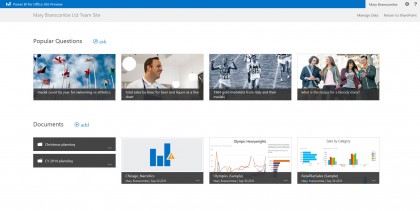
Power BI has a much simpler interface than SharePoint; just a list of documents and folders (which you can add to by sharing queries from Excel spreadsheets where you've done analyses with Power Query or Power Map, or by uploading documents by clicking 'Add' on the web page), and queries that you or other users have run recently.
Open a spreadsheet and you get a preview in the Excel Web app, where you can sort and filter your Power Query and Power Map analyses; you can open it in desktop Excel if you need more options.
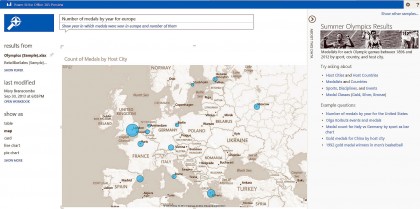
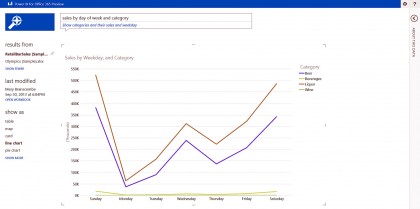
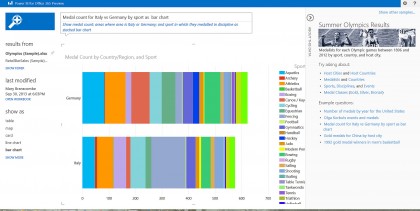
But when you open a query, what you get is the new Q&A interface, where you can type questions in normal English, such as "How much beer is sold on Fridays and Sundays?" Power BI then turns that into a query that looks more like "Show sales and weekday where category name is beer and weekday is Friday or Sunday," and as long as your data has sales figures for the beer category by date, it creates a table, chart, map or total for you.
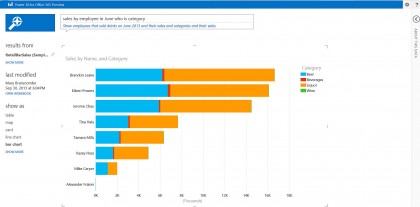
Q&A picks the representation that fits the data best, so you'll get a map for data with geographical information, line, pie, bar, column or scatter charts for figures and tables or totals for information it can't present visually.
Are you a pro? Subscribe to our newsletter
Sign up to the TechRadar Pro newsletter to get all the top news, opinion, features and guidance your business needs to succeed!
But if you don't find that useful, you can pick any of the other layouts.
And if seeing beer sales on Fridays and Sundays gets you curious about whether your bar sells more cocktails or spirits, or which bartender sells the most, or if it's worth staying open late, you can just type more questions in to see more results.
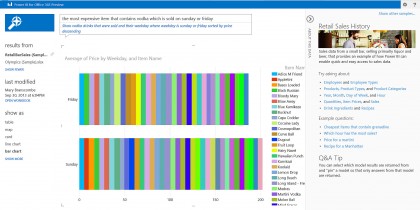
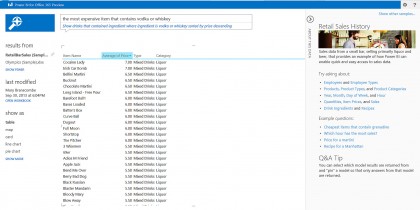
Currently Q&A only works with two sample sets of data from Microsoft, about Olympic medals and a small bar, but you'll be able to add your own data in the future.
You won't need to do anything special to build the model of how to arrange your data; Microsoft says Power BI will figure that out, and you can include simple Excel spreadsheets, SQL databases, big data sources like Hadoop or data sets on Windows Azure. Admins can manage connections to data on your own servers and you can see how many queries are getting made against that data.
In the past, if you wanted to really dig into data, especially if you need to work with data from multiple sources, you needed to understand the power features in Excel - especially Power Query.
This is like pivot tables on steroids, but you can also un-pivot the data if you want to see how someone massaged their data to get results.
Power Map is easier to get started with, but you still have to make decisions like which map type best represents your data. It's the same type of problems as with tools like Tableau; you need to know what you're doing to get useful results.
If you don't have strong Excel skills and you need to dig into business data to find out what's going on, the Q&A feature in Power BI is revolutionary, because you can just type in natural language questions and get useful information that's automatically presented in a relevant chart or map.
It's simple and even fun, because you can look for patterns and things that stick out without getting bogged down in functions and chart options.
You don't even need to be expert at delving through SharePoint sites to find the tools; you can either bookmark the page of queries and spreadsheets in your browser, or use the Windows Store app to open queries directly (we're expecting the iPad app that Microsoft is working on for when the service launches to have similar features).
No matter how well you think you know your business, being able to query the figures visually - and ask the next question you think of when you see an interesting chart - is going to teach you more.
Assuming it works as well with your own data as it does with the samples Microsoft lets you work with in the preview, Power BI is going to make Office 365 a must-have for most businesses.