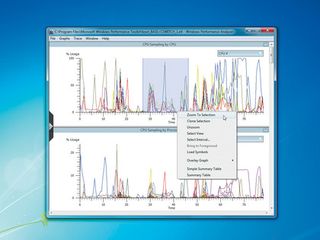
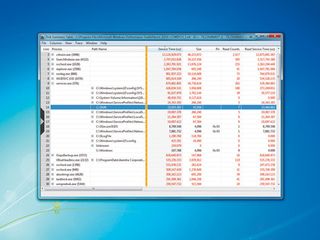
What you take from the boot and shutdown traces will depend on your individual system, but there are some techniques that will be useful generally. If you think Windows services might be extending your boot times, take a look at the 'Services' chart in the 'boot_BASE+CSWITCH_1.etl' file.
The services with the longest bars are most likely to be slowing your PC down; if there are any that you can disable safely, do so.

Look at your boot 'Process lifetimes' graph – does it contain programs you don't need? If so, uninstall them or prevent them loading by default to reduce the load when your PC starts.
Open the Graphs menu and check the 'CPU usage by process' and 'Disk utilisation by process' options. Explore these charts to see which processes make the greatest demands on your system. This told us that 'WMPNETWK. EXE' was responsible for up to 40 per cent of disk use for several seconds of the boot time on our test PC. A Microsoft add-on called 'SeaPort.exe' was also generating lots of hard drive traffic. With a little exploration, you'll soon be looking at improved shutdown and startup times.
Life isn't always so simple though, and you may have intermittent problems. For example, one day boot and shutdown times are fine, the next they seem to take forever. But the Windows Performance Toolkit can still come in useful. Take a trace once a week and save your trace files. Then, if you capture a slow boot or startup in the future, you can compare it to the trace for an ordinary boot and find out what's changed.
Going further
We've looked at how the toolkit can help you monitor simple PC information, but you can look at much more with different XPerf commands.
Get daily insight, inspiration and deals in your inbox
Sign up for breaking news, reviews, opinion, top tech deals, and more.
Are you worried that you may have some driver issues? Fire up XPerf with xperf -on drivers to record driver activity. If you're curious about Registry accesses, try xperf -on registry. There are also commands to tell you about power management (xperf -on power), file-related hard drive activity (xperf on filename), process and thread creation and deletion (xperf -on proc_thread), and a lot more.

Enter xperf -providers kf at the command line to see the other options on your PC. Keep in mind that you can combine multiple flags in the same tracing session, so xperf -on power+registry+drivers monitors power, Registry and driver-related events.
All that really matters is that you experiment. Among all the technicalities, there will also be valuable clues about your PC's performance problems that you can't get anywhere else, and that's worth more than the hour or so you'll spend learning the Windows Performance Toolkit basics.
------------------------------------------------------------------------------------------------------
First published in PC Plus Issue 302
Liked this? Then check outHow to find and fix PC problems with ease
Sign up for TechRadar's free Weird Week in Tech newsletter
Get the oddest tech stories of the week, plus the most popular news and reviews delivered straight to your inbox. Sign up at http://www.techradar.com/register
- 1
- 2
Current page: Why is my PC slow?: Services and Registry
Prev Page Why is my PC slow?: Getting started


