TechRadar Verdict
The AMD Ryzen 9 7950X3D is everything that a gamer could have hoped for with Zen 4 and 3D V-Cache, delivering the same generational performance improvement that we saw with the Ryzen 7 5800X3D with better energy efficiency and some extras thrown in to really sweeten the deal. This is a premium chip though, so it's as expensive as its non-3D sibling, but to its credit it doesn't make you pay more either.
Pros
- +
Best-in-class gaming performance
- +
Outstanding performance-per-watt
- +
Serious creative chops
Cons
- -
Expensive
- -
Gaming performance gains limited at higher graphics settings and resolutions
Why you can trust TechRadar
AMD Ryzen 9 7950X3D: Two-minute review
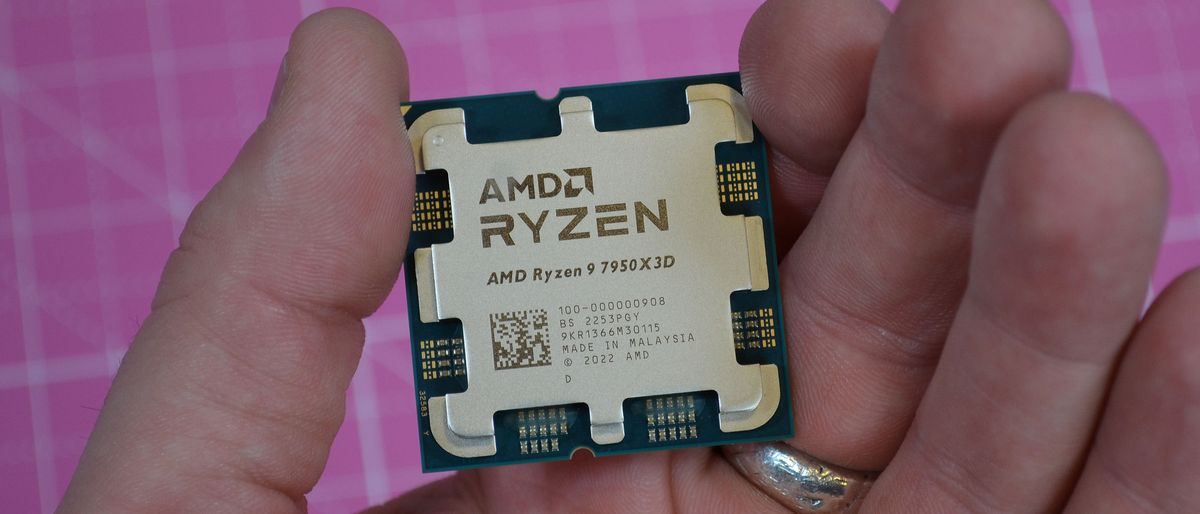
The AMD Ryzen 9 7950X3D is finally here, and it is worth the wait.
First introduced back in early 2022 with the AMD Ryzen 7 5800X3D, AMD's 3D V-Cache technology has proven itself to be an incredible value-add for Team Red that makes AMD's chips seriously competitive against even the best Intel processors.
Even with the non-3D V-Cache variant of AMD's flagship processor, the AMD Ryzen 9 7950X, you were getting a seriously powerful chip that made a worthy rival for the i9-13900K, but the extra gaming performance that 3D V-Cache brings to the table is something to see in action, and it really is AMD's not-so-secret weapon here — especially if you're playing esports titles at 1080p where the speed of the processor is far more important than having the best graphics card.
Even more surprising was the improved creative performance that 3D V-Cache brings to the 7950X3D. I had to retest the 7950X3D's video encoding performance three times to confirm my results because they were so unexpectedly excellent, making it the best processor for video editing work not called Threadripper.
To top it all off, AMD pulls a rabbit out of the hat with the 7950X3D and manages to squeeze significantly better performance at a lower TDP than either the 7950X or the 13900K.
Still, the Ryzen 9 7950X3D is an expensive chip, clocking in at $699 (about £650/AU$1,150). That's the same price as the base Ryzen 9 7950X when it launched back in September 2022, so on the plus side, you're not pay more for the added features in the 7950X3D. Like the 7950X, though, you're still going to have to upgrade to a new AM5 motherboard and DDR5 RAM if you haven't already, which can make this a prohibitively expensive upgrade for some.
Still, when you look at everything on balance, this is arguably the best processor available right now, especially if you're a PC gamer, and it's one that I simply can't see Intel rivaling this generation — 3D V-Cache is just that good.
AMD Ryzen 9 7950X3D: Price & availability
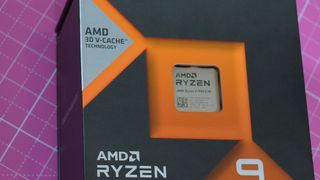
- Same price as the Ryzen 9 7950X
- Intel Core i9-13900K is still cheaper
- Upgrade to AM5 might be very expensive
The AMD Ryzen 9 7950X3D is available globally as of February 28, 2023, and will cost you $699 in the US. We don't have UK and Australia pricing yet, but it will likely run about the same as the MSRP for the Ryzen 9 7950X, which is £649 / AU$1,139. This also makes it more expensive than the Intel Core i9-13900K, which has an MSRP of $589 / £699 / AU$929.
When you factor in the cost of upgrading to the new AM5 platform, the Ryzen 9 7950X3D only makes sense if you are upgrading from an AMD Zen 3 or 11th-gen Intel processor or earlier, since you'll need to buy a whole new setup to get a newer processor from either brand. If you've got a 12th-gen Intel chip, though, making the jump to the AM5 platform for this processor alone is going to be a pricey upgrade.
- Price score: 3.5 / 5
AMD Ryzen 9 7950X3D: Chipset & features
- 3D V-Cache comes to Zen 4
- Better power efficiency
As far as the chip itself, there isn't a whole lot of difference between this processor and its non-3D sibling in terms of architecture, so if you want more of a deep dive into AMD Zen 4, definitely check out my AMD Ryzen 9 7950X review for further info.
For brevity's sake, I'll keep things to the three major differences between the two chips. For starters, there is obviously 3D V-Cache on the 7950X3D, which slaps a extra slab of cache memory across one of the compute dies in the chip package, adding 64MB L3 Cache to the already substantial 80MB that the 7950X had.
Cache is simply a very direct form of working memory that the processor keeps close by for instructions and data that it is using at that very moment. The more cache a processor has, the fewer trips to RAM it needs to make for data or instructions, which greatly improves performance for many common tasks. Generally, more cache is better, and the 7950X3D has more cache than any consumer processor available today.
The other difference in terms of those dies is that not every core has access to this additional V-Cache. The 16 cores are split between two dies: one eight-core die with access to 3D V-Cache at a lower clock frequency, and another eight-core die without the extra cache but with a fully enabled clock speed.
AMD's chip drivers automatically detect if a program or game will benefit from having a faster clock frequency or access to more cache and assigns the process to the cores best suited for the task. In practice, this seems to work very well behind the scenes without any adjustments from the user beyond installing the upgraded drivers when you install the chip, but there still might be some optimizations that need to be worked out, especially when it comes to benchmark tests, but we'll get to that in a minute.
Finally, the last major difference is the lower TDP on the 7950X3D compared to the 7950X (120W to 125W). This is mostly from the lower frequency on the 3D V-Cache cores (as well as some other optimizations), meaning that the 7950X3D can use less power overall to get the same or better performance.
- Chipset & features score: 5 / 5
AMD Ryzen 9 7950X3D: Performance
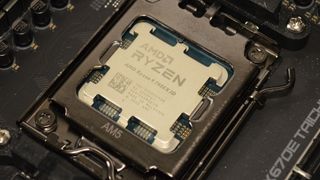
- Best-in-class gaming performance
- Outstanding performance-per-Watt
- Runs behind 7950X and 13900K on synthetic tests, but trounces everywhere else
Speaking of performance — boy howdy, this is a hell of a processor. It doesn't always hit the highest score on a given test, and it can often lag 5% to 10% behind the 7950X or i9-13900K on a few synthetic CPU benchmarks like CineBench R23 or Geekbench 5, but that could be chalked up to the pre-release BIOS and chipset drivers I used for testing. Even if that isn't the case, nobody buys a processor to run artificial test suites on it.
When it comes to the real-world performance of the 7950X3D, it will either hold its own against the other two flagship chips in tests like PCMark 10 or it will absolutely wallop its rivals thanks to its considerably bigger cache when gaming or encoding video.
| Header Cell - Column 0 | 7950X3D | 7950X | Difference |
|---|---|---|---|
| Geekbench Single | 1,993 | 2,241 | -11.08% |
| Geekbench Multi | 23,098 | 22,096 | 4.53% |
| CineBench R23 Single | 1,882 | 1,960 | -3.96% |
| CineBench R23 Multi | 37,549 | 36,297 | 3.45% |
| 3DMark Timespy CPU | 14,699 | 14,584 | 0.79% |
| PCMark 10 | 9,936 | 10,139 | -2.01% |
| PassMark | 63,547 | 64,391 | -1.31% |
| Header Cell - Column 0 | 7950X3D | 13900K | Difference |
|---|---|---|---|
| Geekbench Single | 1,993 | 2,169 | -8.11% |
| Geekbench Multi | 23,098 | 23,648 | -2.33% |
| CineBench R23 Single | 1,882 | 2,252 | -16.43% |
| CineBench R23 Multi | 37,549 | 40,432 | -7.13% |
| 3DMark Timespy CPU | 14,699 | 20,744 | -29.14% |
| PCMark 10 | 9,936 | 10,157 | -2.18% |
| PassMark | 63,547 | 52,923 | 20.08% |
When it comes to the synthetic benchmarks, there's very little difference between the 7950X3D and the 7950X. Both chips are phenomenal multitaskers, and though the 7950X has consistently stronger single core scores than the 7950X3D, the 7950X3D performs better with multi core performance than its non-3D V-Cache counterpart.
When it comes to the Intel Core i9-13900K, it too outperforms the 7950X3D in single core performance, with the 7950X3D running about 12% slower than the 13900K on average. The difference between the two tightens on multicore performance, with the 7950X3D running about 5% slower in multicore on average.
It's a bit of a wash on the more "general" performance tests like PCMark 10, and 3DMark's Time Spy CPU test and PassMark's CPU tests have pretty divergent scores in opposite directions, so are more likely to be outliers than anything.
Going off these numbers alone, you'd be forgiven for thinking that the 7950X3D is on the ropes, but the entire picture changes when moving off the straight synthetic tests into creative and gaming performance.
| Header Cell - Column 0 | 7950X3D | 7950X | Performance Difference |
|---|---|---|---|
| Blender Monster | 283 | 279 | 1.44% |
| Blender Junkshop | 176 | 171 | 3.14% |
| Blender Classroom | 138 | 135 | 2.45% |
| PugetBench for Adobe Photoshop | 1411 | 1352 | 4.36% |
| PugetBench for Adobe Premiere | 1362 | 1389 | -1.94% |
| HandBrake 1.6 (FPS) | 124 | 91 | 36.76% |
| HandBrake 1.6 (Time, Seconds) | 143 | 194 | -26.40% |
| VRay 5 CPU | 27,723 | 29,693 | -6.63% |
| Header Cell - Column 0 | 7950X3D | 13900K | Difference |
|---|---|---|---|
| Blender Monster | 283 | 290 | -2.41% |
| Blender Junkshop | 176 | 166 | 6.02% |
| Blender Classroom | 138 | 135 | 2.22% |
| PugetBench for Adobe Photoshop | 1411 | 1528 | -7.66% |
| PugetBench for Adobe Premiere | 1362 | 1483 | -8.16% |
| HandBrake 1.6 (FPS) | 124 | 92 | 34.78% |
| HandBrake 1.6 (Time, Seconds) | 142 | 192 | -25.32% |
| VRay 5 CPU | 27,723 | 26,693 | 3.85%% |
The Ryzen 9 7950X3D pretty much matches the 7950X in Blender and Adobe Photoshop and Adobe Premiere tests, though it lags a bit in VRay 5 (though not by that much). Where it really shines though is with HandBrake 1.6. This is one of the creative tests we use where we get to measure it's true real-world performance on a creative workload, especially one that is highly CPU dependent.
Here, the 7950X3D encodes a 4K source video file into 1080p@30 at 124 frames per second, which is the fastest I have ever seen any chip other than an AMD Threadripper accomplish. It is nearly 35% faster than the Intel Core i9-13900K, widely considered the best consumer processor for creatives out there, and 36% faster than the Ryzen 9 7950X. This latter comparison is the most fascinating since it shows very clearly how much that extra cache memory alone can impact performance.
| Header Cell - Column 0 | 7950X3D | 7950X | Performance Difference |
|---|---|---|---|
| Returnal (Min FPS) | 127 | 103 | 23.62% |
| Returnal (Avg FPS) | 274 | 238 | 14.99% |
| Total War: Warhammer III Battle (Min FPS) | 464 | 410 | 13.17% |
| Total War: Warhammer III Battle (Avg FPS) | 555 | 496 | 11.79% |
| F1 2022 (Min FPS) | 427 | 338 | 26.33% |
| F1 2022 (Avg FPS) | 560 | 464 | 20.69% |
| Tiny Tina's Wonderland (Min 1% FPS) | 440 | 325 | 35.23% |
| Tiny Tina's Wonderland (Avg FPS) | 523 | 393 | 33.34% |
| Header Cell - Column 0 | 7950X3D | 13900K | Performance Difference |
|---|---|---|---|
| Returnal (Min FPS) | 127 | 85 | 50.69% |
| Returnal (Avg FPS) | 274 | 169 | 61.93% |
| Total War: Warhammer III Battle (Min FPS) | 464 | 532 | -12.78% |
| Total War: Warhammer III Battle (Avg FPS) | 555 | 611 | -9.25% |
| F1 2022 (Min FPS) | 427 | 340 | 25.59% |
| F1 2022 (Avg FPS) | 560 | 448 | 25.00% |
| Tiny Tina's Wonderland (Min 1% FPS) | 440 | 443 | -0.79% |
| Tiny Tina's Wonderland (Avg FPS) | 523 | 525 | -0.31% |
This difference is even more telling when it comes to gaming performance. Compared to the 7950X, the 7950X3D performs like it is fully one to two generations ahead of its non-3D V-Cache counterpart with roughly 20% to 25% better gaming performance at 1080p. Likewise, when it comes to the Intel Core i9-13900K, the 7950X3D lands about 16% to 19% faster on average, but some games will perform substantially better, and the 7950X3D is never that far behind the 13900K when it does occasionally lose out.
Obviously, the CPU is only one component in the equation of PC gaming performance, and these test results are based on games running at the lowest graphics quality at 1080p with an extremely overpowered graphics card (an RTX 4090) to reduce any fps bottleneck you'll get from the GPU.
Increase the graphics quality to max settings and the resolution to 4K and even the RTX 4090 won't be able to keep up with any of these processors, and the advantage of 3D V-Cache shrinks considerably and eventually you'll find yourself GPU-locked regardless of what CPU you're using.
So, it's important to understand that it is not the only element that matters for your gaming performance, and for a lot of gamers, it might not even be the most important one. But, it's there nonetheless, and its impact can be substantial. Esports players especially will love the 7950X3D, as this chip performs best under the exact conditions most commonly used in competitive esports titles.
| Header Cell - Column 0 | 7950X3D | 7950X | Performance Difference |
|---|---|---|---|
| Min Power Draw (W) | 26.561 | 16.521 | 60.77% |
| Max Power Draw (W) | 136.414 | 211.483 | -35.50% |
| Min Temperature (°C) | 36.9 | 38.0 | -2.89% |
| Max Temperature (°C) | 89.1 | 93.6 | -4.81% |
| Header Cell - Column 0 | 7950X3D | 13900K | Performance Difference |
|---|---|---|---|
| Min Power Draw (W) | 26.561 | 2.882 | 821.62% |
| Max Power Draw (W) | 136.414 | 332.001 | -58.91% |
| Min Temperature (°C) | 36.9 | 32.0 | 15.31% |
| Max Temperature (°C) | 89.1 | 93.0 | -4.19% |
What's also so notable about the 7950X3D is that while Intel's latest processors have been outstanding, that performance is far more a function of just throwing power at the problem, literally, than it is some kind of technological magic behind the scenes.
In terms of power draw, the minimum I recorded for the 13900K is a meager 2.882W, and it could hover around this for hours if you're not using your computer thanks to its energy-efficient hybrid-core design. Meanwhile, the 7950X3D is still slurping up just over eight times as much power as a baseline.
On the other hand, when a game like Total War: Warhammer III is running, energy efficiency on the 13900K goes right out the window and you start getting power draw above 330W just for the processor. This allows the 13900K to eke out up to 68 more fps than the 7950X3D (or 532 minimum fps for the 13900K to the 7950X3D's 464 minimum fps), but it literally needs almost 2.5 times as much power to accomplish this.
And that's for the best gaming performance the 13900K scored against the 7950X3D among the games we tested. In a game like Returnal, which is a sophisticated bullet-hell rouge-like with lots of projectile physics needing to be calculated every frame, the 7950X3D can outperform the 13900K by as much as 61% and do so with substantially less power.
| Category | 7950X3D | 7950X | Average of Performance Differences |
|---|---|---|---|
| Synthetic Tests | 21,815 | 22,636 | -1.37% |
| Creative Tests | 4,460 | 4,685 | 5.80% |
| Minimum Gaming FPS | 364 | 294 | 24.59% |
| Average Gaming FPS | 478 | 398 | 20.20% |
| Overall Performance Gain | 9.55% (All tests) |
| Category | 7950X3D | 13900K | Average of Performance Differences |
|---|---|---|---|
| Synthetic Tests | 21,815 | 21,761 | -6.46% |
| Creative Tests | 5,182 | 5,049 | 4.09% |
| Minimum Gaming FPS | 364 | 350 | 15.68% |
| Average Gaming FPS | 478 | 438 | 19.35% |
| Overall Performance Gain | 5.61% (All tests) |
When trying to come to an overall assessment of these chips' relative performance, it's better to look at the measurable performance gains between chips across different tests. This makes for a much more sensible average when all is said and done than averaging absolute scores where one CPU test with one very large result can badly skew a final average.
By this measure, the Ryzen 9 7950X3D outperforms the 7950X by about 10% and the 13900K by about 6% when I average out all of the degrees of difference between the three chips, across every test. But even then, the demonstrably better performance of the 7950X3D can be somewhat obscured, since Intel especially benefits from much higher synthetic benchmark scores that don't really translate cleanly into actual real-world performance where the 7950X3D is simply the better processor overall.
You also really can't discount the performance-per-watt that you're getting with the Ryzen 9 7950X3D, which is at least twice what you'd get with the Intel Core i9-13900K and about 55% better than the 7950X.
Quite simply, AMD does so much more with far less power than either of the competing flagship processors, and you don't have to accept lower performance as a tradeoff. Much more often than not, you're getting a substantially faster processor in practice — especially for gaming — making it very hard to deny the AMD Ryzen 9 7950X3D its due.
It's simply the best gaming CPU by performance you can buy on the consumer market and that's not likely to change for the rest of this processor generation, at the very least.
- Performance: 5 / 5
Should you buy the AMD Ryzen 9 7950X3D?
| Attributes | Notes | Rating |
|---|---|---|
| Value | No price increase over 7950X, but still a potentially unaffordable upgrade | 3.5 / 5 |
| Chipset & features | 3D V-Cache and lower TDP make this a chip to be reckoned with | 5 / 5 |
| Performance | This processor's brings best-in-class performance that likely won't be beat this generation | 5 / 5 |
Buy it if...
You want the best consumer CPU around
Realistically, the only processor that can top the 7950X3D in real-world use would be industrial-strength workstation chips costing several times as much.
You are an esports player
While every PC gamers will see some benefit from this chip no matter their setup, esports players who stick to low settings and 1080p resolution will see substantial gains in FPS thanks to this chip.
You want to dabble in some creative content work
While most serious creative professionals are going to opt for a workstation chip like AMD Threadripper, those who might not have industrial-scale funding or who just want to do some 3D modelling or video editing work on the side for fun (or some extra money) will do well with this chip.
Don't buy it if...
You're on a tight budget
This is AMD's most expensive consumer processor, and it is really for the enthusiast gamer set, so more budget-minded shoppers should consider looking to the Ryzen 7800X3D when it launches in April 2023.
You're a more casual, general purpose user
Not only is this chip expensive, it also has a lot of very specific features that you are paying a lot of money for. If you just need a new processor for a work or family PC, this chip is absolutely overkill and you'll be wasting your money on features you'll never use or even need.
You're looking to seriously overclock your CPU
Unlike the last-gen's Ryzen 7 5800X3D, the 7950X3D does allow for some narrow, controlled overclocking through AMD's Ryzen Master utility, but we're talking about presets rather than setting specific voltages, something you won't be able to do with this chip.
Also Consider
| Header Cell - Column 0 | AMD Ryzen 9 7950X3D | AMD Ryzen 9 7950X | Intel Core i9-13900K |
|---|---|---|---|
| Price | $699 (about £650 / AU$1,150) | $699 / £649 / AU$1,139 | $589 / £699 / AU$929 |
| Performance Cores | 16 | 16 | 8 |
| Efficiency Cores | 0 | 0 | 16 |
| Threads | 32 | 32 | 32 |
| Base Clock (GHz) | 4.50 | 4.50 | 3.00 |
| Boost Clock (GHz) | 5.70 | 5.70 | 5.80 |
| Cache (MB) | 144 | 80 | 68 |
| TDP (W) | 120 | 175 | 125 |
| Motherboard Socket | AM5 | AM5 | LGA 1700 |
If my AMD Ryzen 9 7950X3D review has you considering other options, here are two processors to consider...
Intel Core i9-13900K
Currently the best processor in Intel's arsenal, the i9-13900K is no joke. In terms of raw performance, it goes pound for pound with the best AMD processors and does so at a lower retail price.
Read the full Intel Core i9-13900K review
AMD Ryzen 9 7950X
Before the AMD Ryzen 9 7950X3D, this was Team Red's flagship processor, and it's easily one of the most powerful AMD has ever produced. It might lack 3D V-Cache, but with the 7950X3D hitting the market, this chip is getting price cuts across the board, making it a great pickup if you don't want to shell out for the most expensive consumer processor out there.
Read the full AMD Ryzen 9 7950X review
How I tested the AMD Ryzen 9 7950X3D
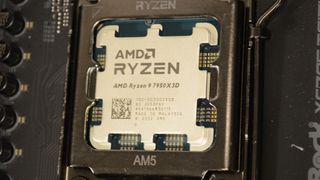
- I spent nearly two weeks testing the AMD Ryzen 9 7950X3D
- I ran comparable benchmarks between this chip and rival flagship processors
- I gamed with this chip extensively
Testing a processor is arguably one of the most involved processes of any component I review because there are so many things to measure and quantify.
Thanks to my extensive computer science background, I have a very clear sense of what is happening inside of a processor and how it is supposed to respond and perform, as well as which tools are best suited to measure these kinds of metrics since this is what I have been doing for nearly a decade now in one form or another.
I use the following tests to measure specific facets of a processor's performance, as described.
- Synthetic single and multi-core benchmarks test the performance of specific instruction sets and processor operations like floating-point calculations using benchmark tools like GeekBench, Cinebench, and PassMark.
- Creative performance is a measure of how well the processor performs in several popular creative workloads like Handbrake, Blender, and Adobe Photoshop. Where possible, I explicitly disable GPU accelerated operations or test rendering using the CPU by itself.
- Gaming performance measures how well the processor calculates gaming operations like in-game physics by running several games' integrated benchmark tools like Returnal, Total War: Warhammer III, and F1 2022. In all cases, I run the benchmarks on the lowest graphics settings available at 1080p and using the most powerful graphics card I have available (in this case, an Nvidia RTX 4090) and with 32GB DDR5 RAM to isolate the actual CPU operations I am testing without having to worry about inteference from excessive memory or graphics management.
- Stress testing tools like Cinebench R23 push the processor to its engineered limits in terms of power use and operating temperature, and I use these to make sure that every chip is pushed to full 100% CPU utilization under load to determine the minimum and maximum amount of power the processor uses (measured in watts) and the minimum and maximum temperature recorded (measured in Celsius).
All of these tests are conducted using the same hardware test bench with the same components as much as possible, including the same RAM modules, graphics card, CPU cooler, and M.2 SSD, to ensure that test results are reflective of differences in a processor architecture and performance, rather than reflecting a bottleneck in a different graphics card or SSD, making scores for different processors comparable.
Finally, I make sure that for every processor, I retest competing processors I have already tested and reviewed and I use the latest motherboard BIOS, Windows updates, and driver updates available. This ensures that there havn't been any optimizations, fixes, or security patches that might significantly change a given test's result and I always use the most up-to-date test results when making comparisons.
First reviewed February 2023

John (He/Him) is the Components Editor here at TechRadar and he is also a programmer, gamer, activist, and Brooklyn College alum currently living in Brooklyn, NY.
Named by the CTA as a CES 2020 Media Trailblazer for his science and technology reporting, John specializes in all areas of computer science, including industry news, hardware reviews, PC gaming, as well as general science writing and the social impact of the tech industry.
You can find him online on Bluesky @johnloeffler.bsky.social
