Why you can trust TechRadar
We shoot a specially designed chart in carefully controlled conditions and the resulting images are analysed using DXO Analyzer software to generate the data to produce the graphs below.
A high signal to noise ratio (SNR) indicates a cleaner and better quality image.
For more more details on how to interpret our test data, check out our full explanation of our noise and dynamic range tests.
JPEG Signal to Noise Ratio results
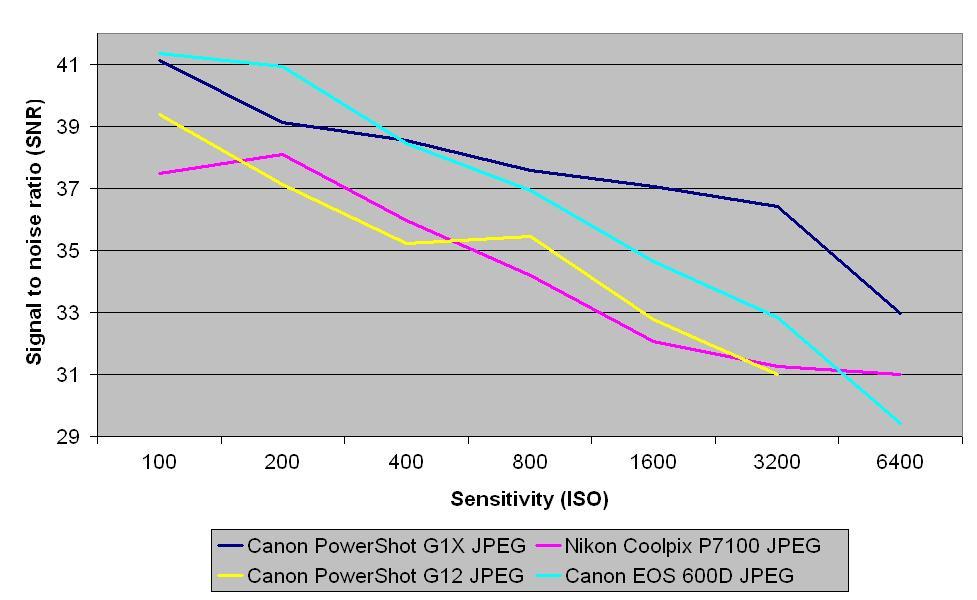
As we might expect, JPEG images from the Canon PowerShot G1 X show an increased signal to noise ratio performance over the Canon PowerShot G12. Although at ISO 100 there is little difference in the results from the G1 X and the Canon EOS 600D, the EOS 600D has the edge at ISO 200, however, above ISO 400 the G1 X produces better signal to noise ratio results.
Raw/TIFF Signal to Noise Ratio results
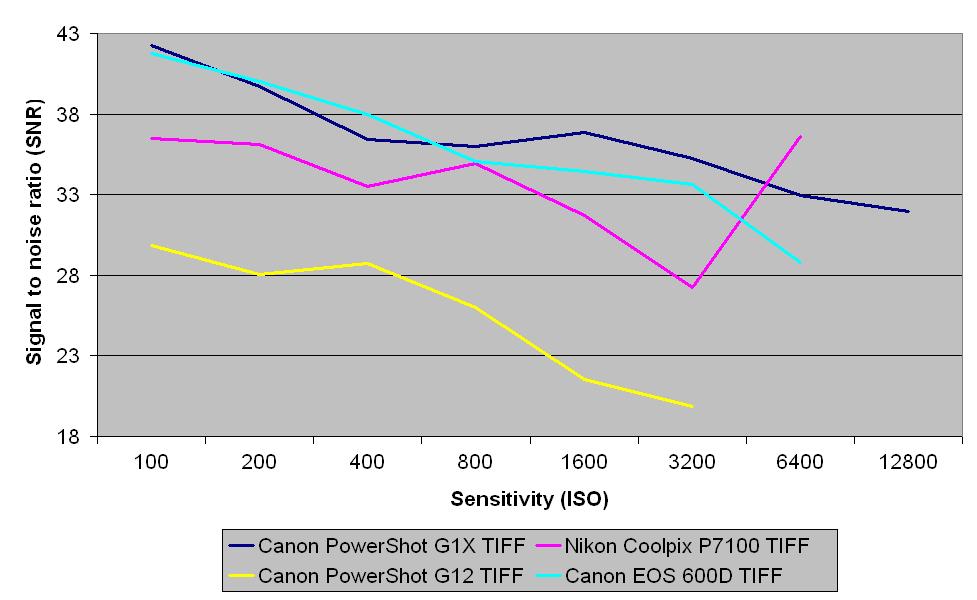
Our TIFF image (after conversion from raw) results show that the Canon PowerShot G1 X and the Canon EOS 600D have similar signal to noise ratios up to a sensitivity of ISO 800. Compared with the Canon PowerShot G12 there is a marked improvement in noise performance showing good lowlight shooting ability.
JPEG Dynamic range
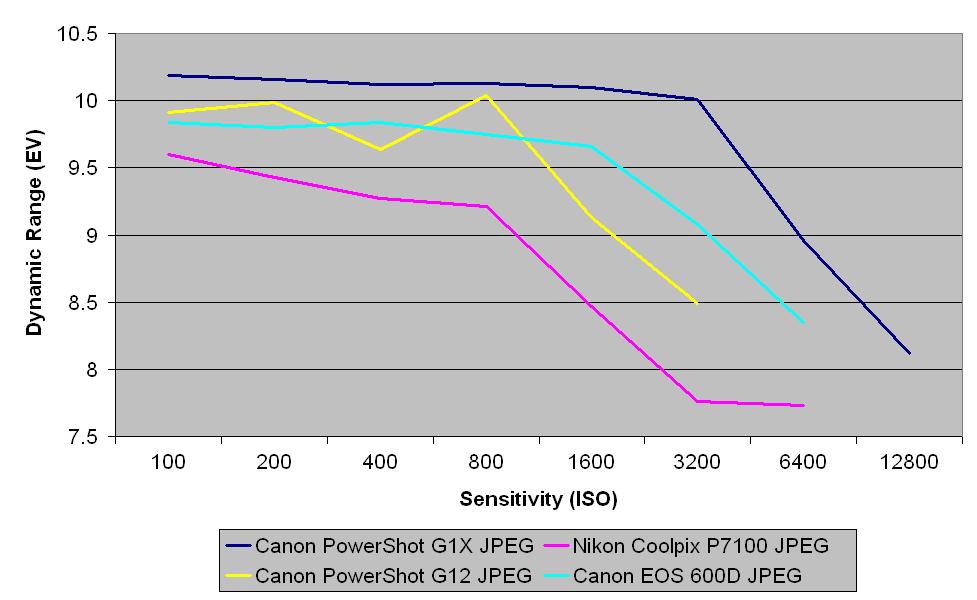
This chart indicates that the Canon PowerShot G1 X captures a wide tonal range throughout its sensitivity settings and even at ISO 12800 a good amount of tonal detail can still be captured.
TIFF Dynamic range
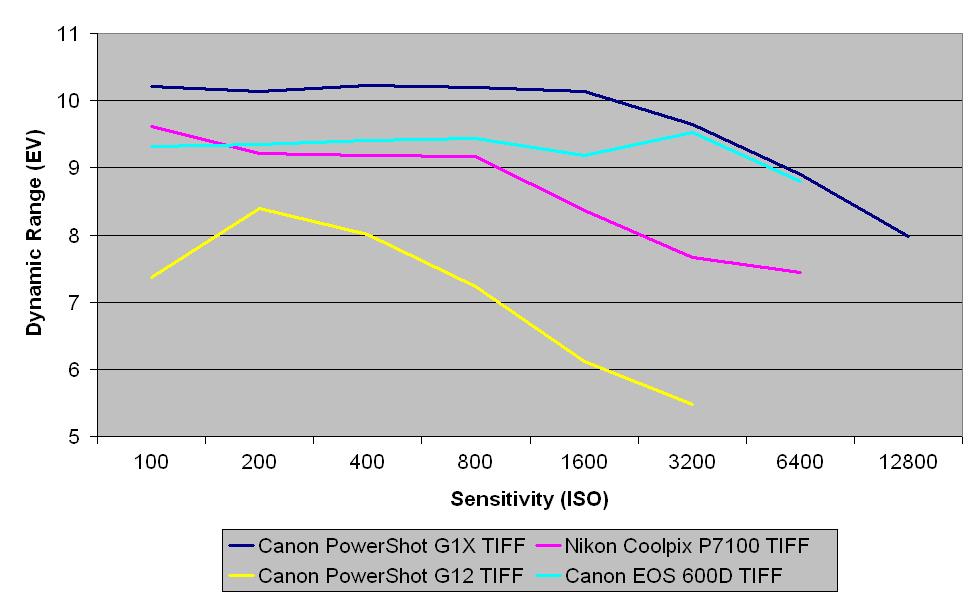
Across its sensitivity range the Canon PowerShot G1 X produces raw files which, after conversion to TIFF just out performs the Canon EOS 600D and captures a wider tonal range than the Canon PowerShot G12.
Current page: Noise and dynamic range
Prev Page Image quality and resolution Next Page Sample images