Why you can trust TechRadar
This is a test of the camera's noise levels. The higher the signal to noise ratio, the greater the difference in strength between the real image data and random background noise, so the 'cleaner' the image will look. The higher the signal to noise ratio, the better.
Canon G3 X signal to noise ratio charts
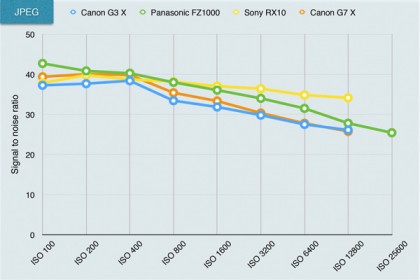
JPEG signal to noise ratio analysis: For most of the sensitivity range the G3 X lags behind the competition a little, indicating that images are noisier; this may be to help preserve image detail.
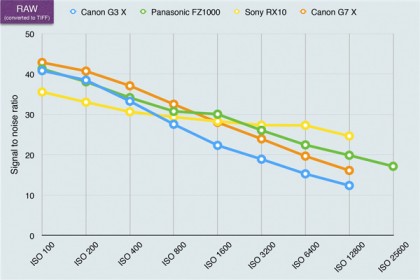
Raw (converted to TIFF) signal to noise ratio analysis: At lower sensitivity values the G3 X has a significantly better score than the Sony RX10, indicating that it has cleaner images, but the situation reverses at around ISO 800.
Sample Canon G3 X ISO test results
The signal to noise ratio charts use laboratory test equipment, but we also shoot a real-world scene to get a visual indication of the camera's noise levels across the ISO range. The right side of the scene is darkened deliberately because this makes noise more obvious.
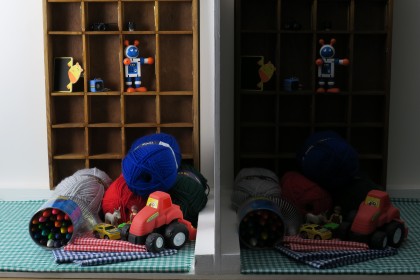
ISO 200 (JPEG): Click here for a full-size version.
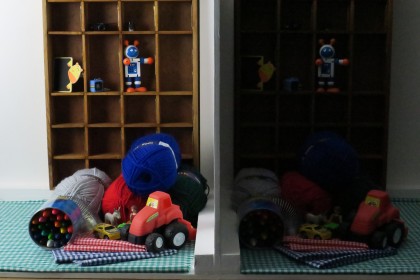
ISO 6400 (JPEG): Click here for a full-size version.
