Why you can trust TechRadar
We shoot a specially designed chart in carefully controlled conditions and the resulting images are analysed using DXO Analyzer software to generate the data to produce the graphs below.
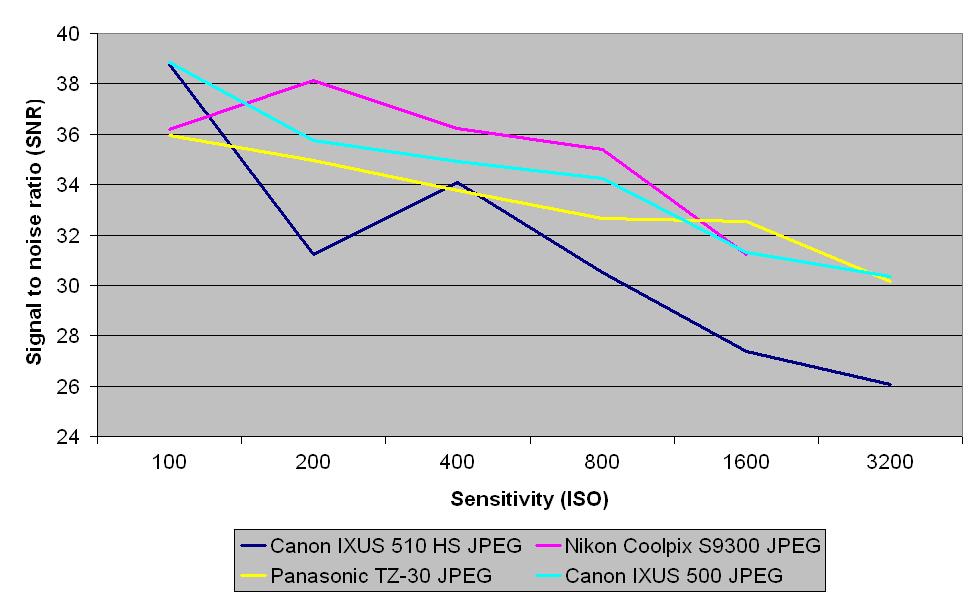
A high signal to noise ratio (SNR) indicates a cleaner and better quality image.
For more more details on how to interpret our test data, check out our full explanation of our noise and dynamic range tests.
JPEG signal to noise ratio

JPEG images from the Canon IXUS 510 HS show that noise is handled well up to a sensitivity of ISO 800. Above this value noise starts to become more of an issue.
Dynamic range

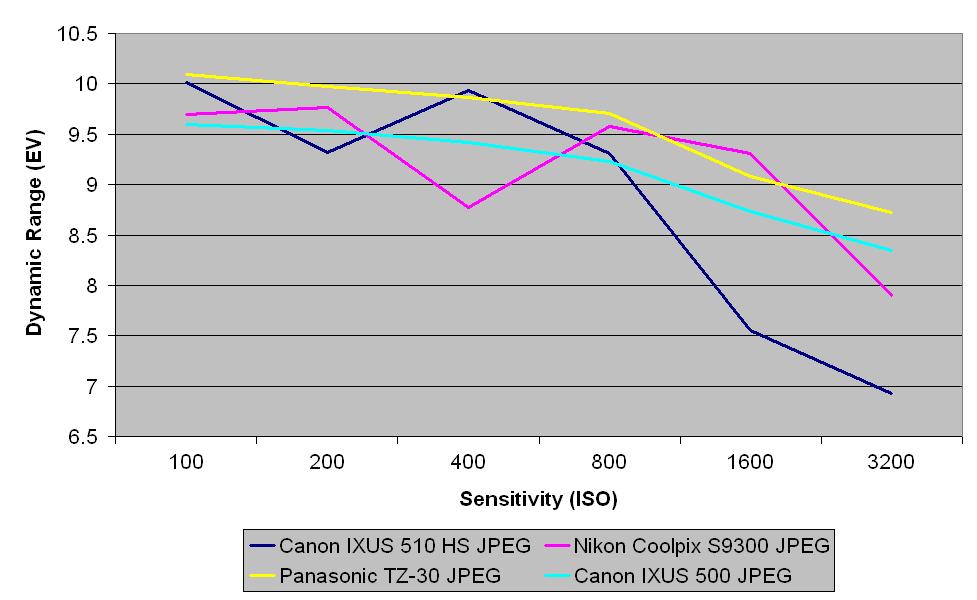
This chart indicates that the Canon IXUS 510 HS compares well against the Nikon Coolpix S9300,Panasonic TZ30 and Canon IXUS 500 HS up to a sensitivity of ISO 800. Above this value, tonal graduation in both the shadows and highlights can be lost easily.
Current page: Noise and dynamic range
Prev Page Image quality and resolution Next Page Sample imagesDave is a professional photographer whose work has appeared everywhere from National Geographic to the Guardian. Along the way he’s been commissioned to shoot zoo animals, luxury tech, the occasional car, countless headshots and the Northern Lights. As a videographer he’s filmed gorillas, talking heads, corporate events and the occasional penguin. He loves a good gadget but his favourite bit of kit (at the moment) is a Canon EOS T80 35mm film camera he picked up on eBay for £18.
