Why you can trust TechRadar
We shoot a specially designed chart in carefully controlled conditions and the resulting images are analysed using DXO Analyzer software to generate the data to produce the graphs below.
A high signal-to-noise ratio (SNR) indicates a cleaner and better quality image.
For more more details on how to interpret our test data, check out our full explanation of our noise and dynamic range tests.
JPEG Signal to noise ratio
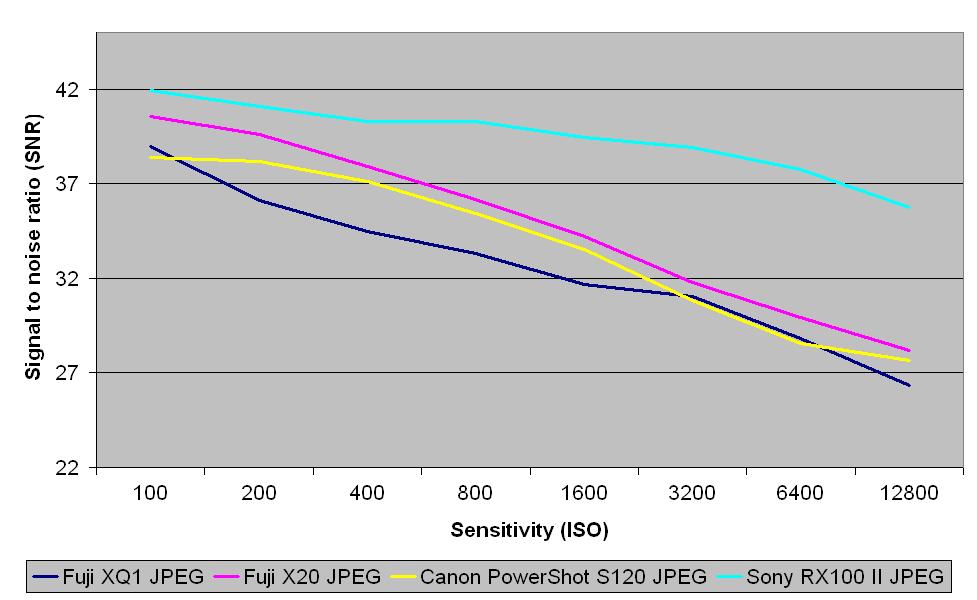
This suggests that images from the XQ1 are a little noisier than those from the other cameras, but the resolution scores are good indicating that detail has been preserved at the expense of a little noise.
Raw (after conversion to TIFF) signal to noise ratio
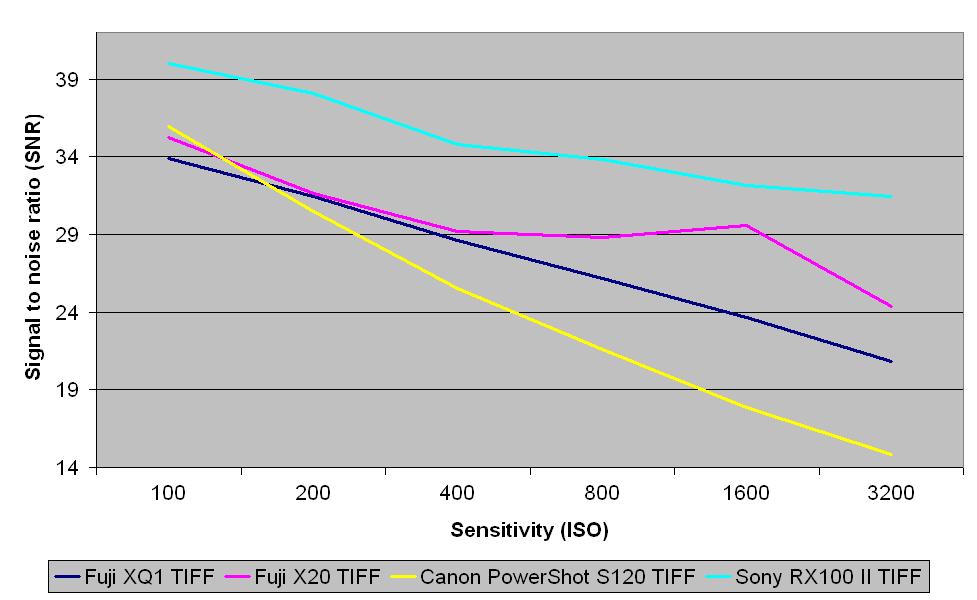
Apart from at the lowest sensitivity settings the XQ1 produces cleaner images with a stronger signal than the Canon S120. It's performance is close to the Fuji X20's up to around ISO 400, from here images become a bit noisier.
JPEG dynamic range
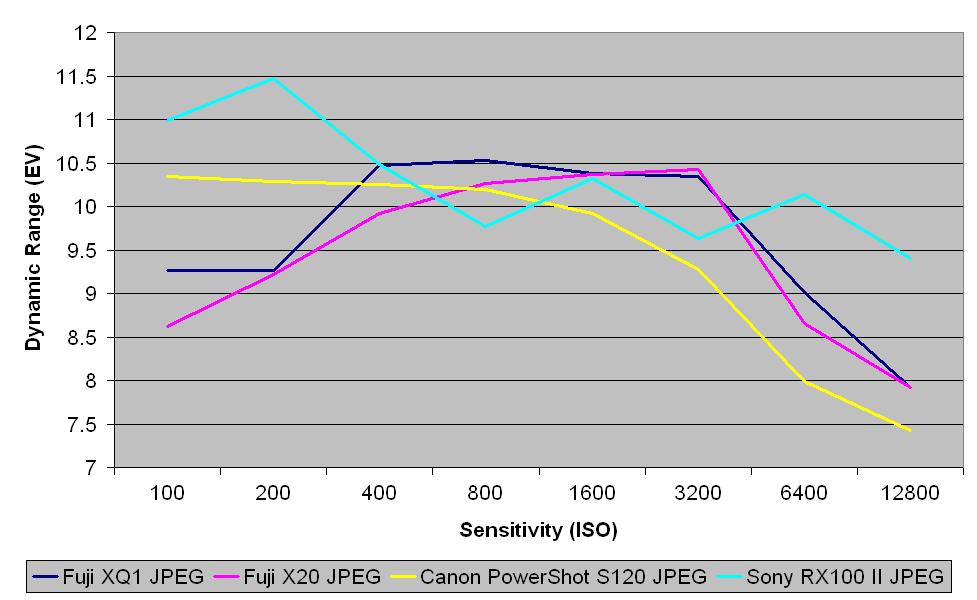
The XQ1 shows the same strange dynamic range pattern as the X20, getting wider at the mid sensitivity values - where it beats the competition.
Raw (after conversion to TIFF) dynamic range
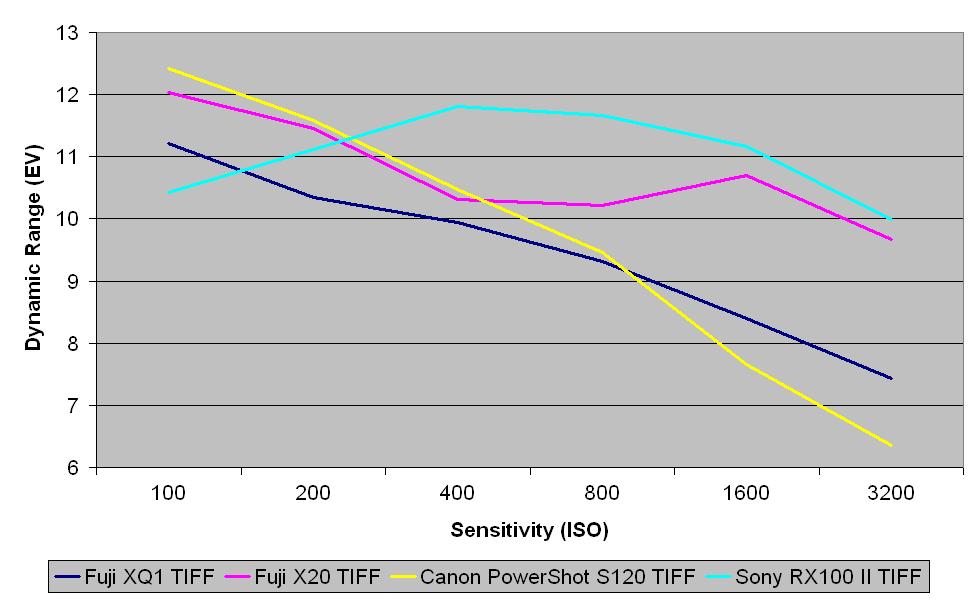
This shows that the XQ1's dynamic range is more restricted than the other cameras' apart from at ISO 100 where it beats the Sony RX100 II and at the higher sensitivities where it out performs the Canon S120.
Current page: Noise and dynamic range
Prev Page Image quality and resolution Next Page Sensitivity and noise images