Why you can trust TechRadar
These graphs were produced using data generated by DXO Analyzer. The raw files are analysed with no conversion or processing to enable us to evaluate the intrinsic image quality of the sensor. This avoid the problems that arise from the fact that different raw converters produce very differnt results. We also analyse JPEG images with the camera in its default settings, so we can see what you get straight from the camera.
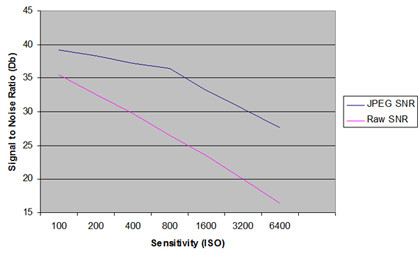
Olympus XZ-1 Signal to Noise Ratio (SNR) graph

A high signal to noise ratio (SNR) indicates a cleaner image. As we would expect, the JPEG images have less noise than the raw files and the level of noise goes up with sensitivity and thus image quality decreases. The difference between the raw and JPEG files gives an indication of the amount of in-camera noise reduction applied.
As we analyse more cameras we will add to this graph to allow comparisons to be made.
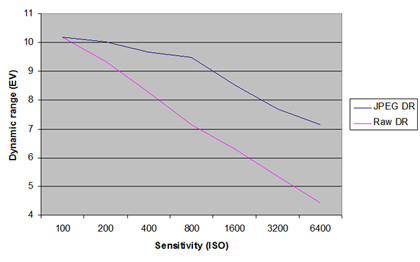
Olympus XZ-1 Dynamic range graph

Our analysis indicates that the dynamic range of the XZ-1's raw output decreases in an almost linear fashion from just over 10EV at ISO 100 to around 4.5EV at ISO 6400. The in-camera optimisation, which happens automatically to make images closer to print-ready, means that JPEG files have a higher dynamic range than simultaneously captured raw files. JPEG dynamic range bottoms out just above 7EV at ISO 6400.
Current page: Olympus XZ-1: Noise and dynamic range
Prev Page Olympus XZ-1: Sample photos Next Page Olympus XZ-1: Verdict