Why you can trust TechRadar
This is a test of the camera's noise levels. The higher the signal to noise ratio, the greater the difference in strength between the real image data and random background noise, so the 'cleaner' the image will look. The higher the signal to noise ratio, the better.
Panasonic CM1 signal to noise ratio charts
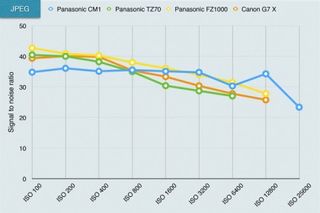
JPEG signal to noise ratio analysis: Interestingly, the CM1 shows slightly more noise than the rest at low ISOs but maintains its performance as the ISO setting increases so that by ISO 1600 it's coming out on top.
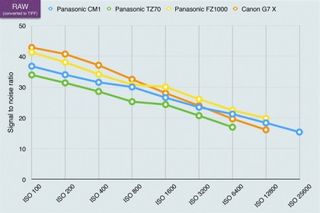
Raw (converted to TIFF) signal to noise ratio analysis: The story is slightly different with the raw files, where the CM1 turns in a mid-field performance ahead of the TZ70 travel camera but a little behind the Panasonic FZ1000 and Canon G7 X.
Noise/sensitivity samples
The signal to noise ratio charts use laboratory test equipment, but we also shoot a real-world scene to get a visual indication of the camera's noise levels across the ISO range. The right side of the scene is darkened deliberately because this makes noise more obvious. Here are two samples from our ISO series.

ISO 100: Click here to see a full size version.

ISO 6400: Click here to see a full size version.
Overall analysis: The Panasonic CM1 holds its own against two of the best compact cameras on the market right now. More to the point, its lens and processor do seem to squeeze the maximum potential out of that big 1-inch sensor. As a camera, the CM1 isn't just good by phone standards, it's good by proper camera standards.
Current page: Lab tests: signal to noise ratio
Prev Page Lab tests: dynamic range Next Page Performance and verdict