Why you can trust TechRadar
We shoot a specially designed chart in carefully controlled conditions and the resulting images are analysed using DXO Analyzer software to generate the data to produce the graphs below.
A high signal to noise ratio (SNR) indicates a cleaner and better quality image.
For more more details on how to interpret our test data, check out our full explanation of our noise and dynamic range tests.
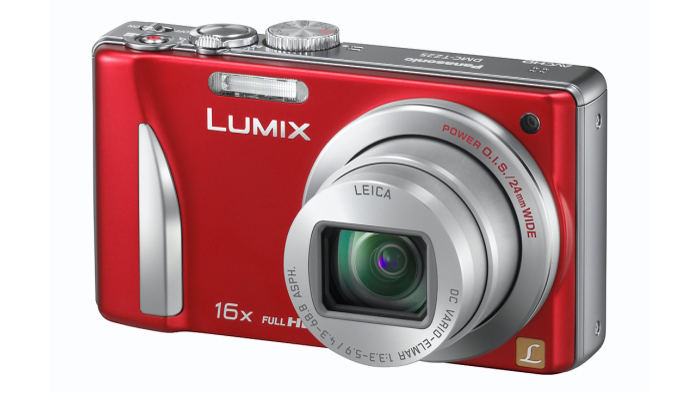
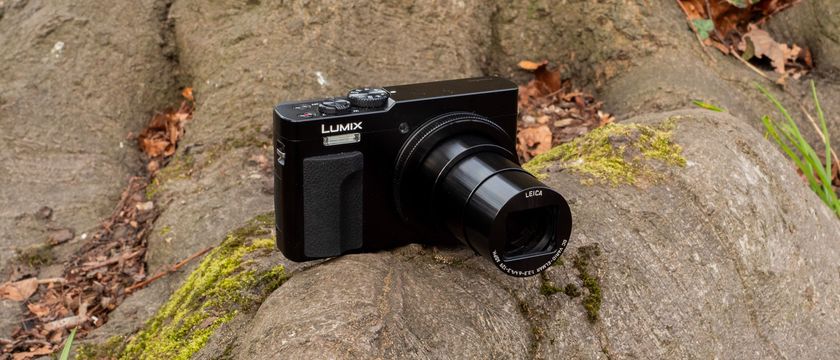
Here we compare the Panasonic TZ25 with the Panasonic TZ30, Canon PowerShot SX260 andSamsung WB750.
Signal to noise ratio
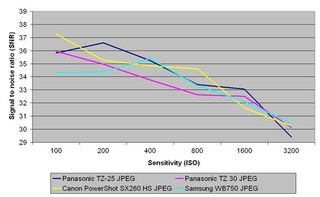
These results show that the Panasonic TZ25's JPEG files have a similar signal to noise ratio to those from the Panasonic TZ30, Canon PowerShot SX260 and Samsung WB750, coming out top at ISO 200 and ISO 1600, bottom at ISO 3200 and in the middle at the other settings.
Dynamic range
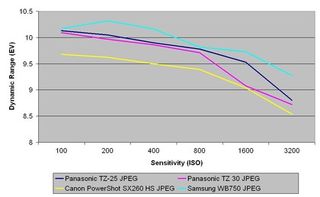
Image results for dynamic range are less prone to fluctuations than those for signal to noise ratio, with the Panasonic TZ25 consistently taking second place at all sensitivities, behind the Samsung WB750and ahead of the Panasonic TZ30 and Canon PowerShot SX260.
Current page: Noise and dynamic range
Prev Page Image quality and resolution Next Page Sample images