Why you can trust TechRadar
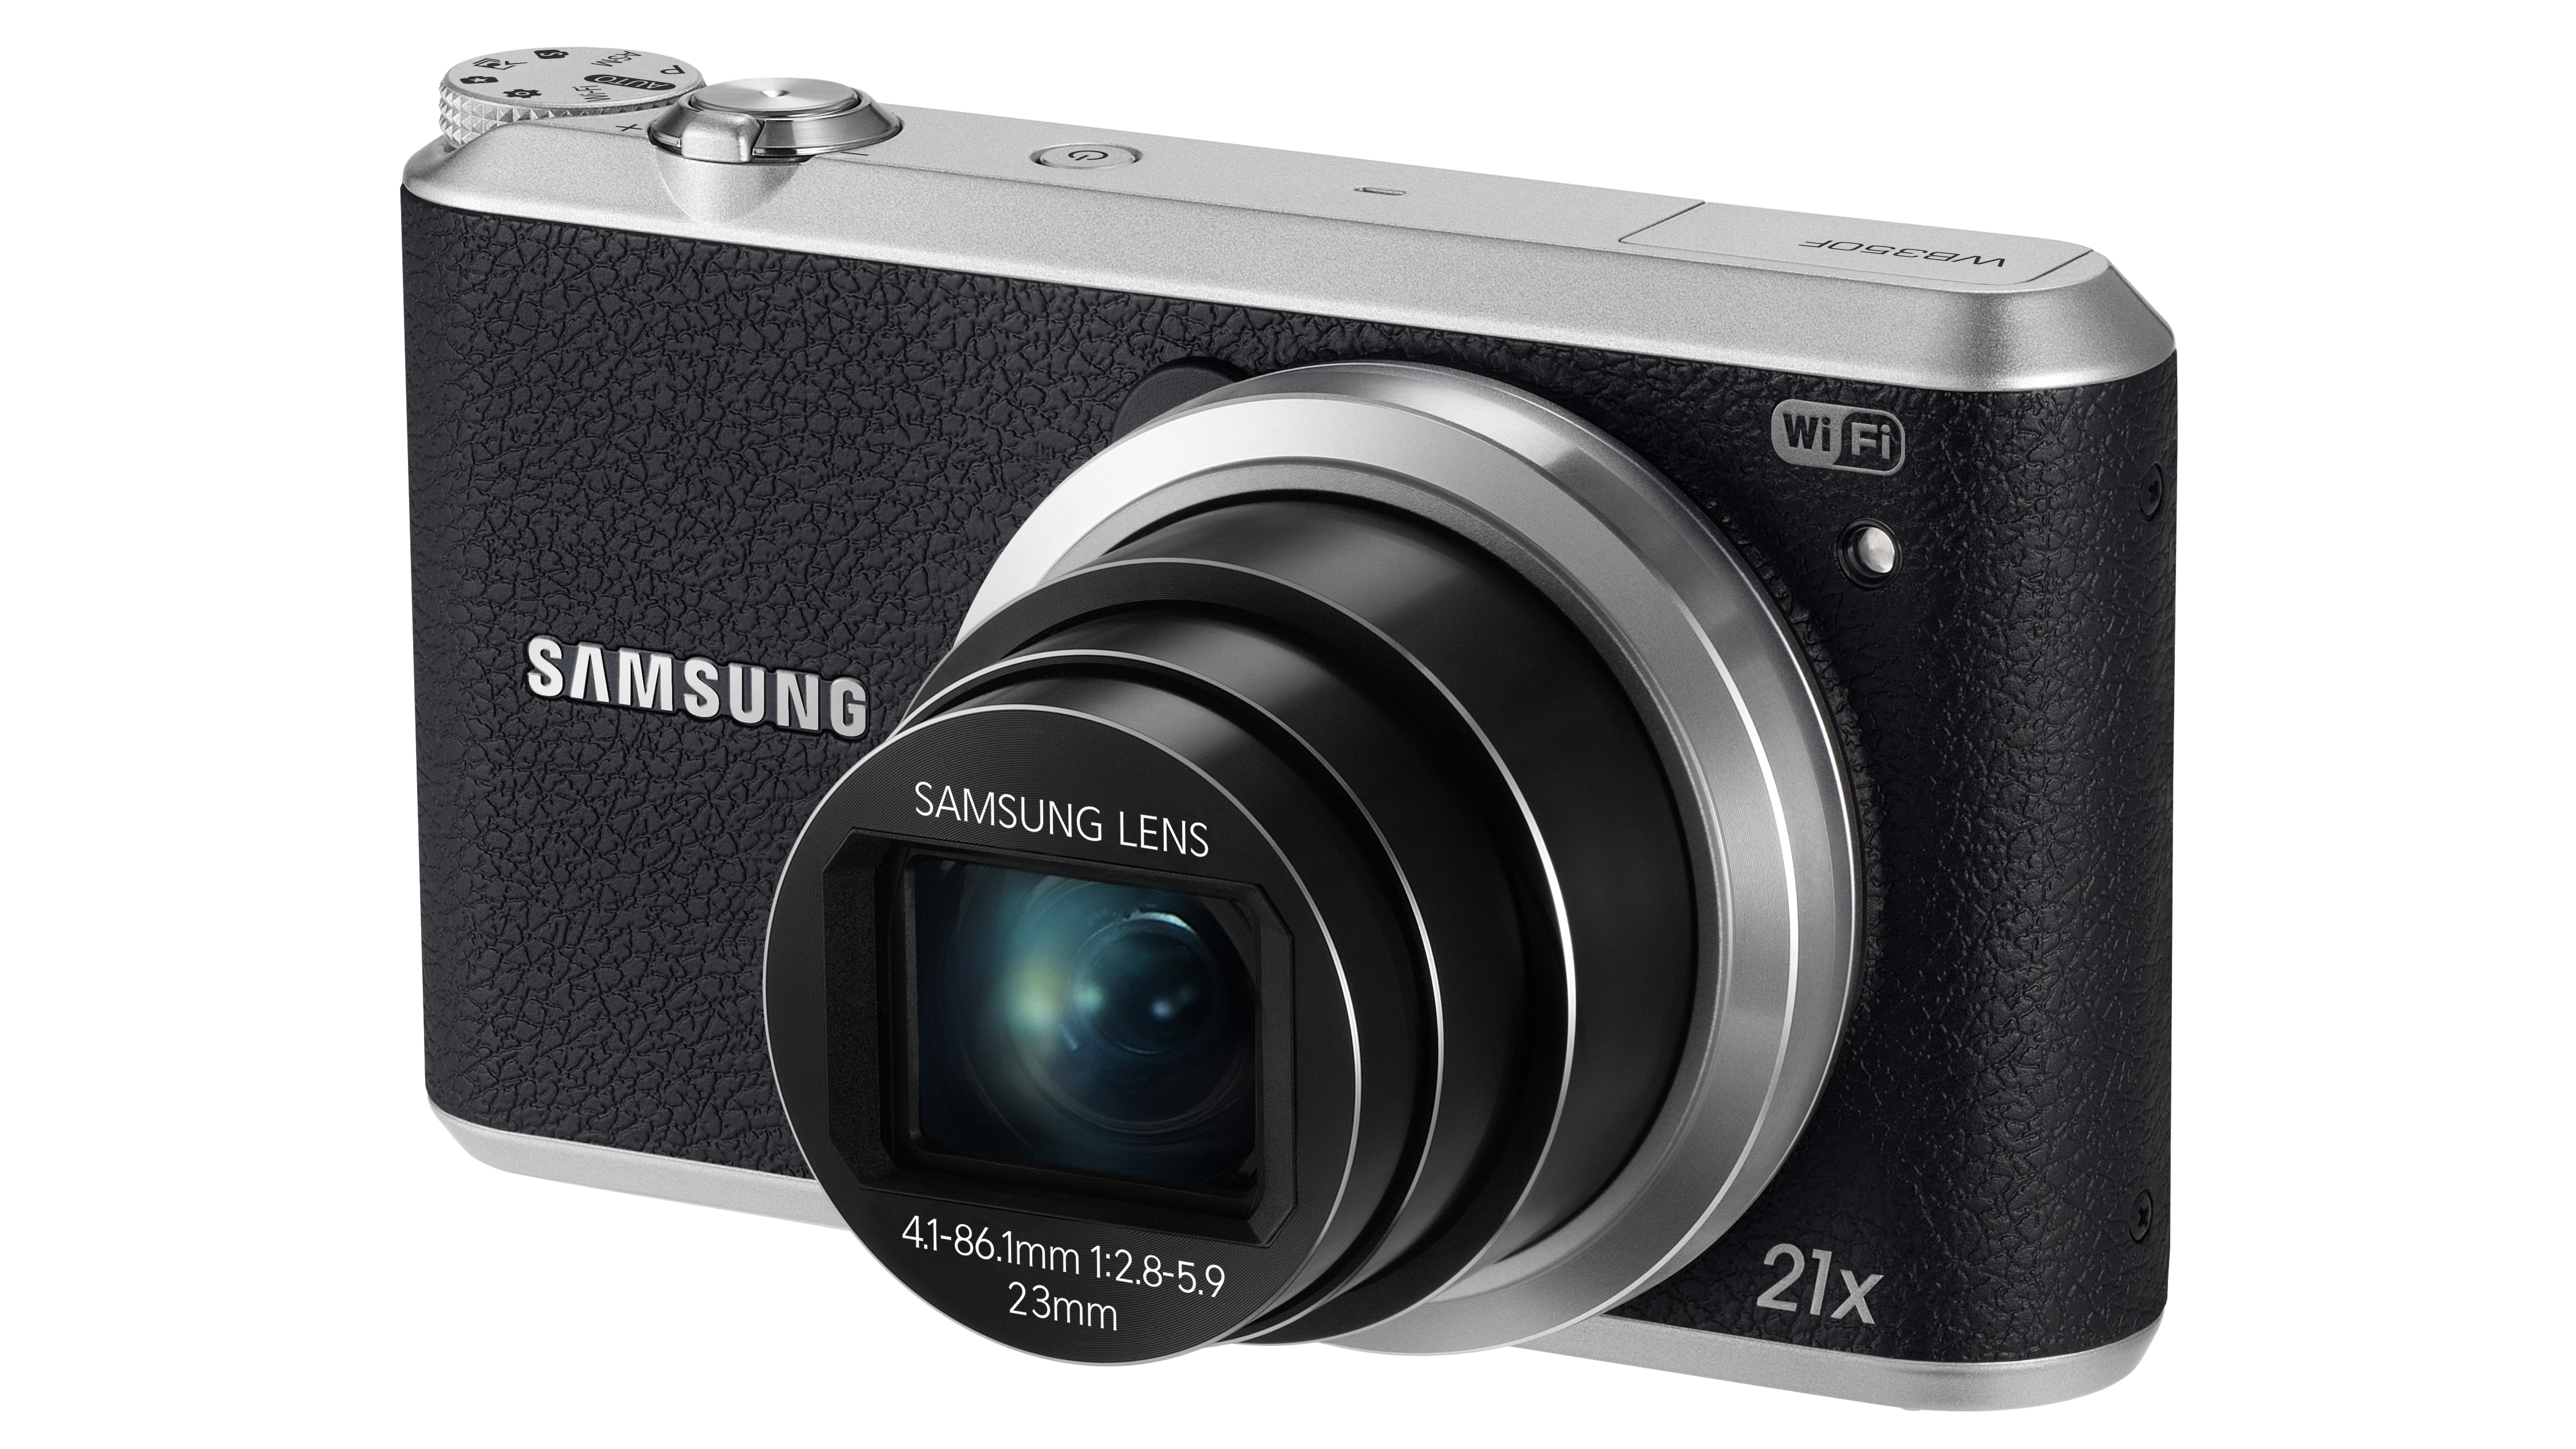
As part of our image quality testing for the Samsung WB350F review, we've shot our resolution chart. These images were captured using a full-production sample of the camera.
For a full explanation of what our resolution charts mean, and how to read them, check out our full explanation of our camera testing resolution charts.
Examining images of the chart taken at each sensitivity setting reveals the following resolution scores in line widths per picture height x100:
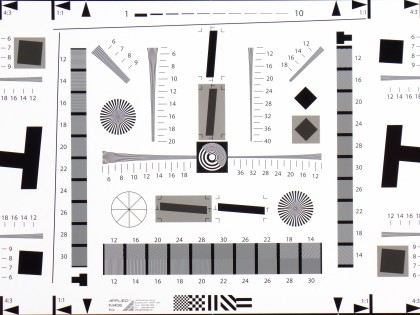
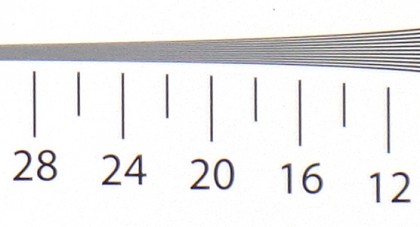
ISO 80, Score: 20 (Click here to see the full resolution image)
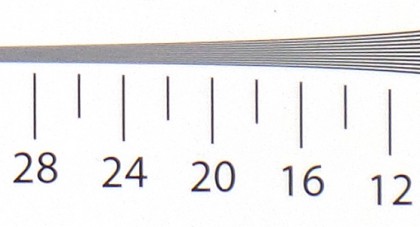
ISO 100, Score: 20 (Click here to see the full resolution image)
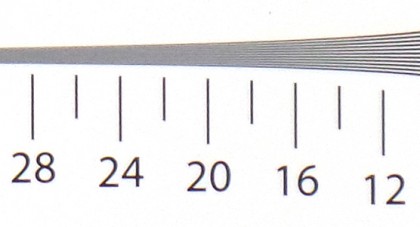
ISO 200, Score: 16 (Click here to see the full resolution image)
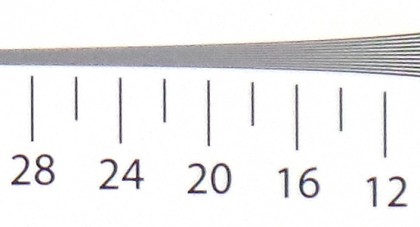
ISO 400, Score: 14 (Click here to see the full resolution image)
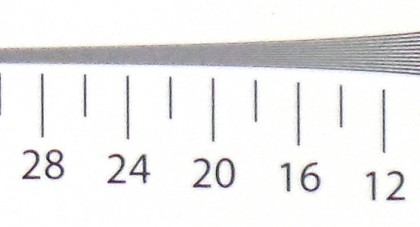
ISO 800, Score: 12 (Click here to see the full resolution image)
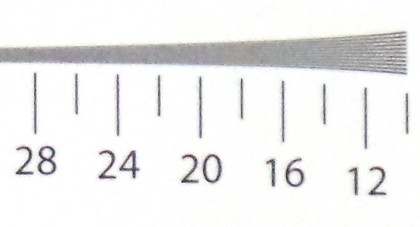
ISO 1600, Score: 10 (Click here to see the full resolution image)
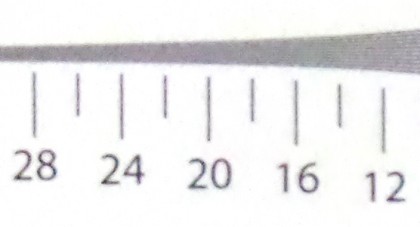
ISO 3200, Score: N/A (Click here to see the full resolution image)
Current page: Image quality and resolution
Prev Page Introduction and features Next Page Sensitivity and noise images