Why you can trust TechRadar
We shoot a specially designed chart in carefully controlled conditions and the resulting images are analysed using DXO Analyzer software to generate the data to produce the graphs below.
A high signal to noise ratio (SNR) indicates a cleaner and better quality image.
For more more details on how to interpret our test data, check out our full explanation of our noise and dynamic range tests.
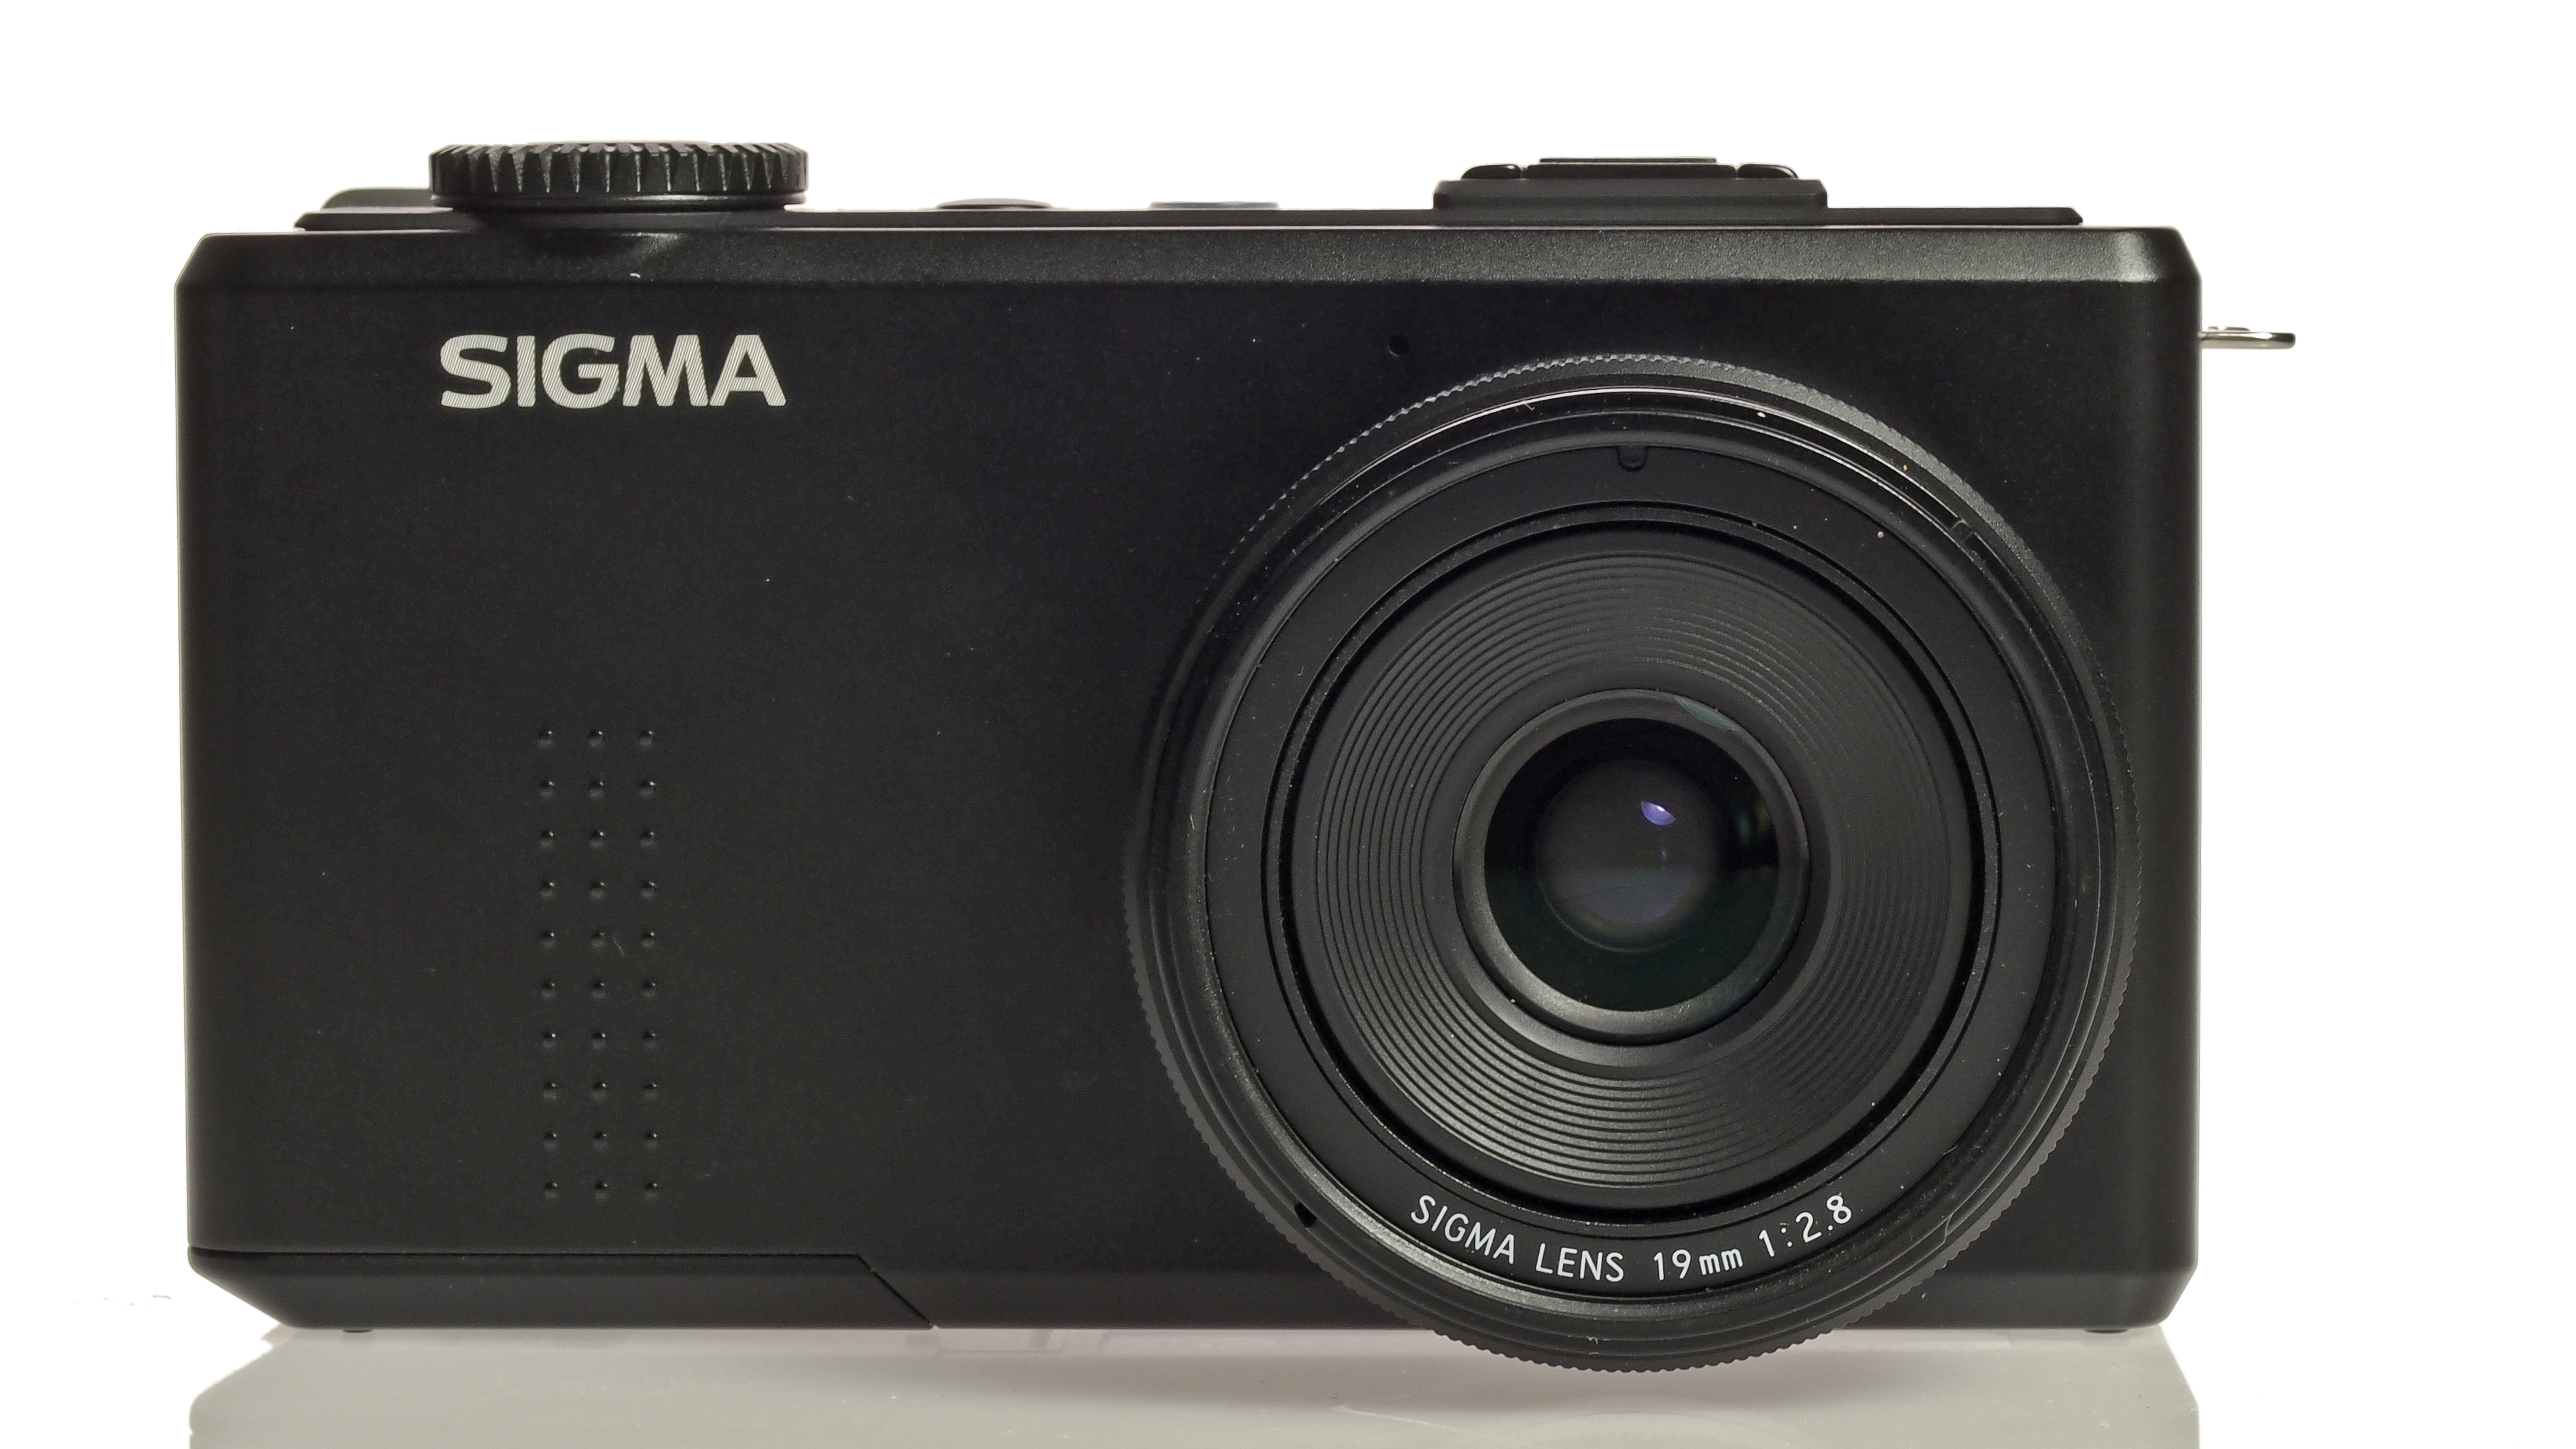
Here we compare the Sigma DP1 Merrill with the Panasonic LX7, Fuji X100 and Olympus XZ-2.
JPEG signal to noise ratio
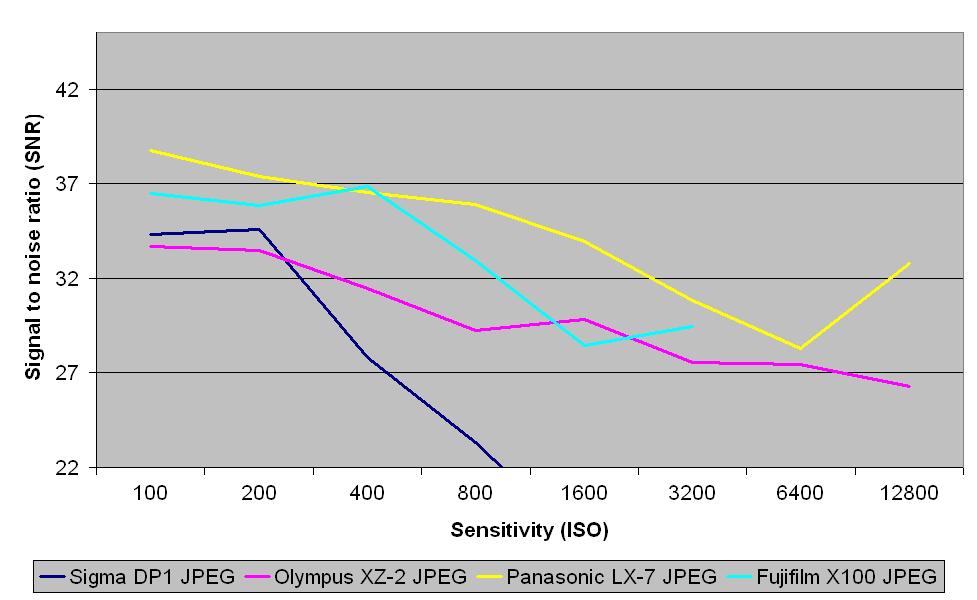
These results show that the Sigma DP1 Merrill's JPEG files have a low signal to noise ratio when compared to those from the with the Panasonic LX7, Fuji X100 and Olympus XZ-2, coming in just above the Olympus at ISO 100-200, and bottom of the pile at the higher sensitivities that it was able to reach.
Raw signal to noise ratio
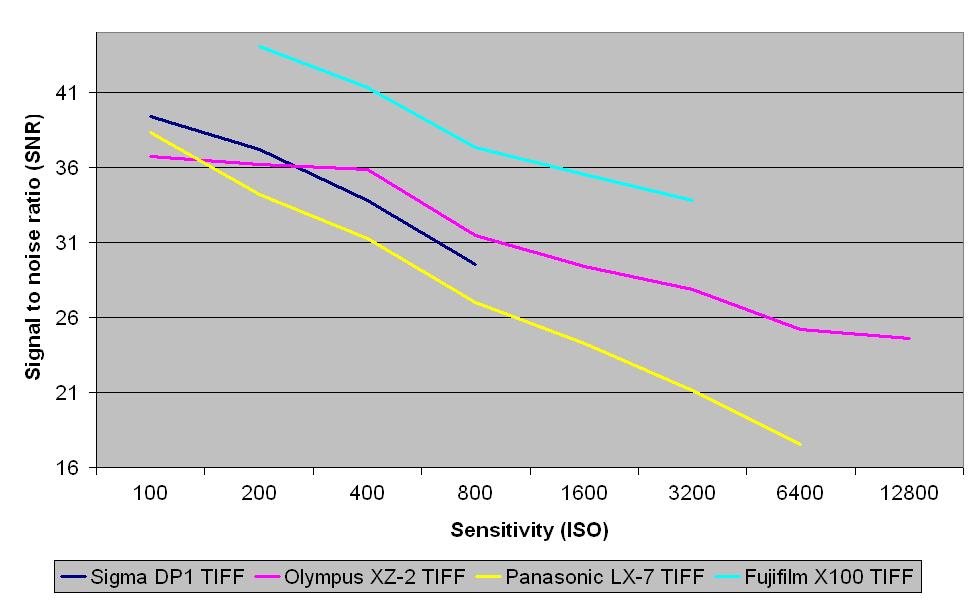
The signal to noise ratios of the TIFF images (after conversion from raw) from the Sigma DP1 Merrill are slightly stronger, beating the Panasonic LX7 throughout its whole sensitivity range, and the Olympus XZ-2 at ISO 100-200. It produced weaker results than the Fuji X100 at every ISO setting, however.
JPEG dynamic range
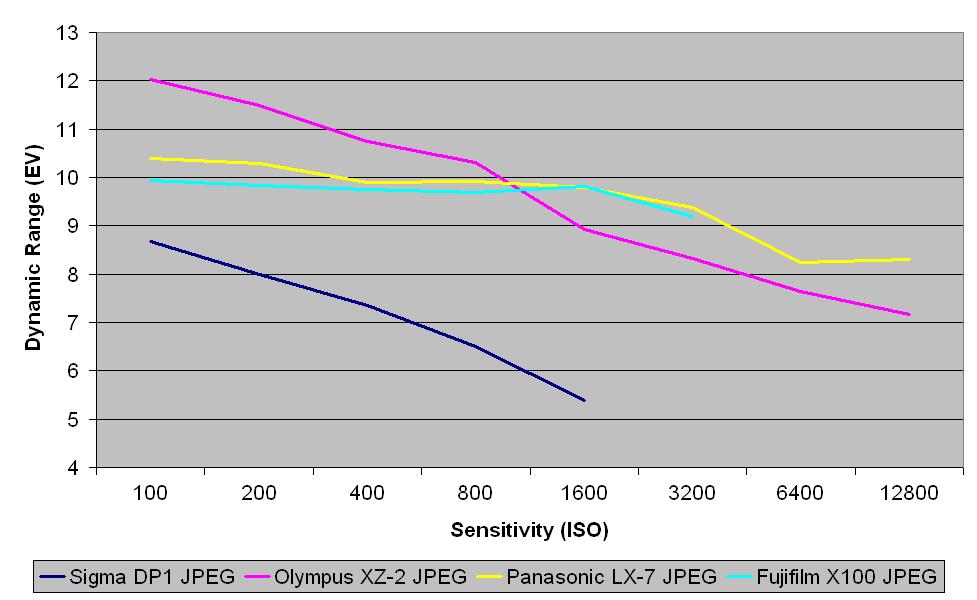
For dynamic range in its JPEG images, the Sigma DP1 Merrill sits at the bottom of the pile, with the Olympus XZ-2 coming out on top, followed by the Panasonic LX7, then the Fuji X100.
Raw dynamic range
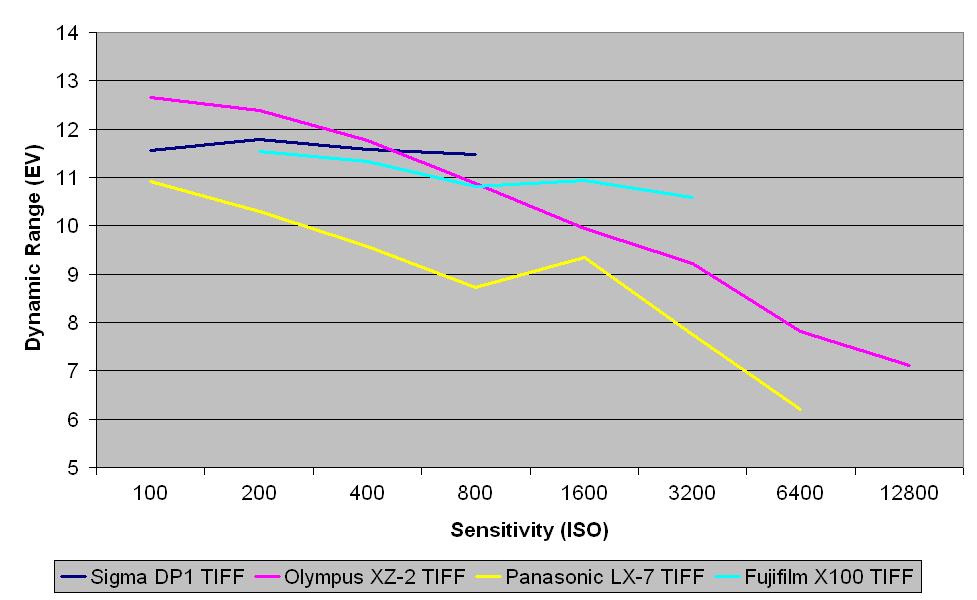
This chart indicates that TIFF images (after conversion from raw) from the Sigma DP1 Merrill are second-strongest at ISO 100-400, sitting just below the Olympus XZ-2 and above the Panasonic LX7 and Fuji X100. It comes out top at ISO 800, the top of its measurable range.
Current page: Noise and dynamic range
Prev Page Image quality and resolution Next Page Sample images