Why you can trust TechRadar
This is a test of the camera's noise levels. The higher the signal to noise ratio, the greater the difference in strength between the real image data and random background noise, so the 'cleaner' the image will look. The higher the signal to noise ratio, the better.
Canon EOS 760D signal to noise ratio charts
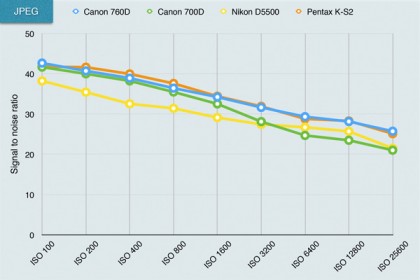
JPEG signal to noise ratio analysis: Interestingly, the 760D produces a similar or slightly better signal to noise ratio to the 700D, which indicates that the images have a similar level of noise despite the increase in pixel count and detail resolution. This brings it up to (and beyond) the level of the Nikon and Pentax cameras.
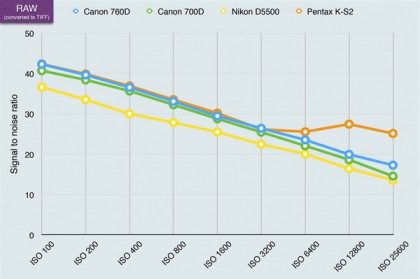
Raw* signal to noise ratio analysis: The 760D puts in a good raw signal to noise performance, beating the D5500 and indicating that it produces slightly cleaner images. It has no advantage over the EOS 700D or Pentax K-S2, though.
Noise/sensitivity samples
The signal to noise ratio charts use laboratory test equipment, but we also shoot a real-world scene to get a visual indication of the camera's noise levels across the ISO range. The right side of the scene is darkened deliberately because this makes noise more obvious.

ISO 100: Click here for a full size version.

ISO 6400: Click here for a full size version.
