Why you can trust TechRadar
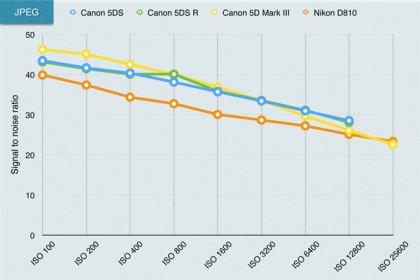
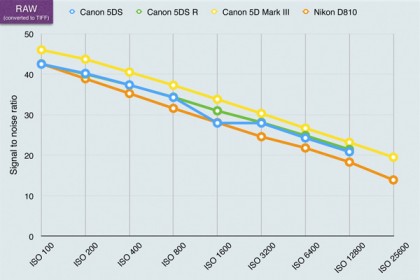
This is a test of the camera's noise levels. The higher the signal to noise ratio, the greater the difference in strength between the real image data and random background noise, so the 'cleaner' the image will look. The higher the signal to noise ratio, the better.
Canon EOS 5DS signal to noise ratio charts

JPEG signal to noise ratio analysis: While it beats the Nikon D810, the smaller size of the photoreceptors on the 5DS's sensor's is likely to explain why it can't quite match the medium format Pentax 645Z (not shown) and lower resolution Canon 5D Mark III for signal to noise ratio at the low to mid-range sensitivity settings. The newer sensor and processing engine, however, enable it to beat the competition at higher settings. There's no real performance difference between the 5DS and 5DS R.

Raw (converted to TIFF) signal to noise ratio analysis: These results indicate that the 5DS and 5DS R produce noisier raw images (after conversion to TIFF using the supplied software) than the 5D Mark III. Nevertheless, they put in a good performance, beating the Nikon D810.
Sample Canon EOS 5DS ISO test results
The signal to noise ratio charts use laboratory test equipment, but we also shoot a real-world scene to get a visual indication of the camera's noise levels across the ISO range. The right side of the scene is darkened deliberately because this makes noise more obvious.

ISO 100: Click here for a full size version.

ISO 6400: Click here for a full size version.
