Why you can trust TechRadar
This is a test of the camera's noise levels. The higher the signal to noise ratio, the greater the difference in strength between the real image data and random background noise, so the 'cleaner' the image will look. The higher the signal to noise ratio, the better.
Canon EOS M3 signal to noise ratio chart
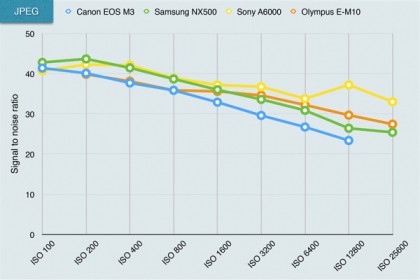
JPEG signal to noise ratio analysis: At the lowest sensitivity values the M3 has a similar score to the Samsung NX500 and Sony A6000, but it drops behind as sensitivity rises, indicating that images are a little noisier. This is confirmed by our 'real world' images. Revealing a bit more noise gives the M3's images more bite, and helps them look a little sharper at 100%.
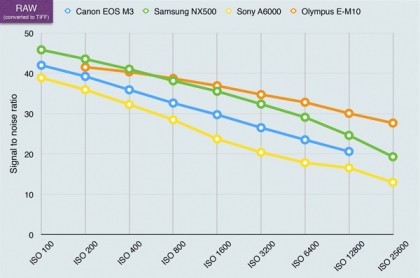
Raw signal to noise ratio: The M3's raw files (after conversion to TIFF) compare more favourably than the JPEGs, suggesting that the files have more detail and less noise. Even so, its results fall in the middle of the range and the Samsung NX500 and Olympus E-M10 are clearly
Noise/sensitivity samples
The signal to noise ratio charts use laboratory test equipment, but we also shoot a real-world scene to get a visual indication of the camera's noise levels across the ISO range. The right side of the scene is darkened deliberately because this makes noise more obvious.

This is the Canon EOS M3's result at ISO 100. Click here to view a full size version.

And this is the same scene at ISO 6400. Click here to see a full size version.
