Why you can trust TechRadar
We shoot a specially designed chart in carefully controlled conditions and the resulting images are analysed using DXO Analyzer software to generate the data to produce the graphs below.
A high signal to noise ratio (SNR) indicates a cleaner and better quality image.
For more more details on how to interpret our test data, check out our full explanation of our noise and dynamic range tests.
Here we compare the Fuji X-M1 with the Sony NEX-3N, Fuji X-E1, Olympus E-PM2 and Panasonic GF6. The Fuji X-M1 has the greatest sensitivity range of all the cameras here.
JPEG signal to noise ratio
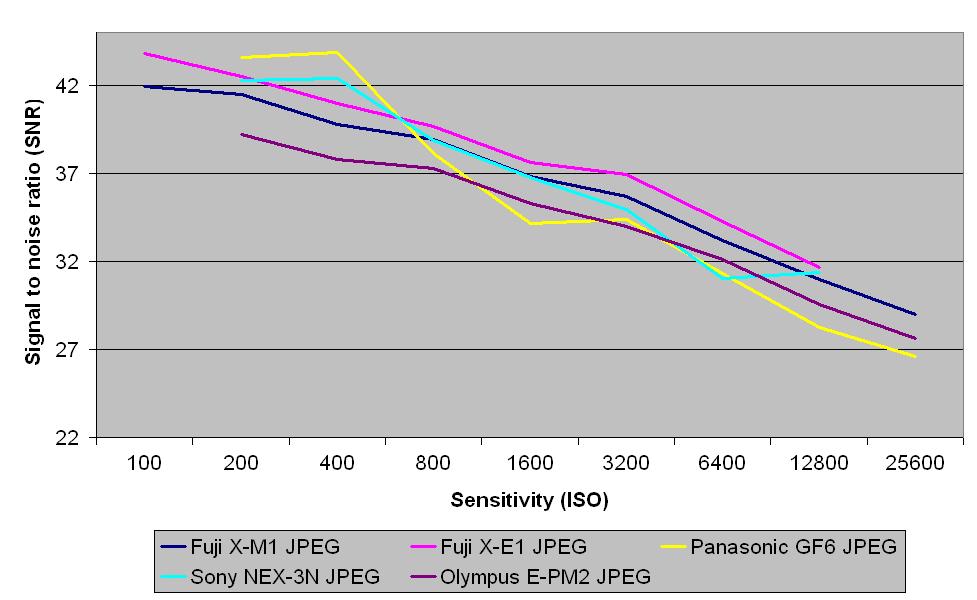
As we can see from this graph, JPEGs from the Fuji X-M1 contain greater signal to noise ratios than JPEGs from the Olympus E-PM2 at every sensitivity setting, though they have weaker ratios than those from the Fuji X-E1 at every sensitivity. The Fuji X-M1's JPEG images have greater signal to noise ratios than those from the Panasonic GF6 at every setting except ISO 200 and 400, and are stronger than the Sony NEX-3N's at ISO 3200 and 6400, score similar results at ISO 800 and 1600 and are weaker at ISO 200, 400 and 12800.
Raw signal to noise ratio
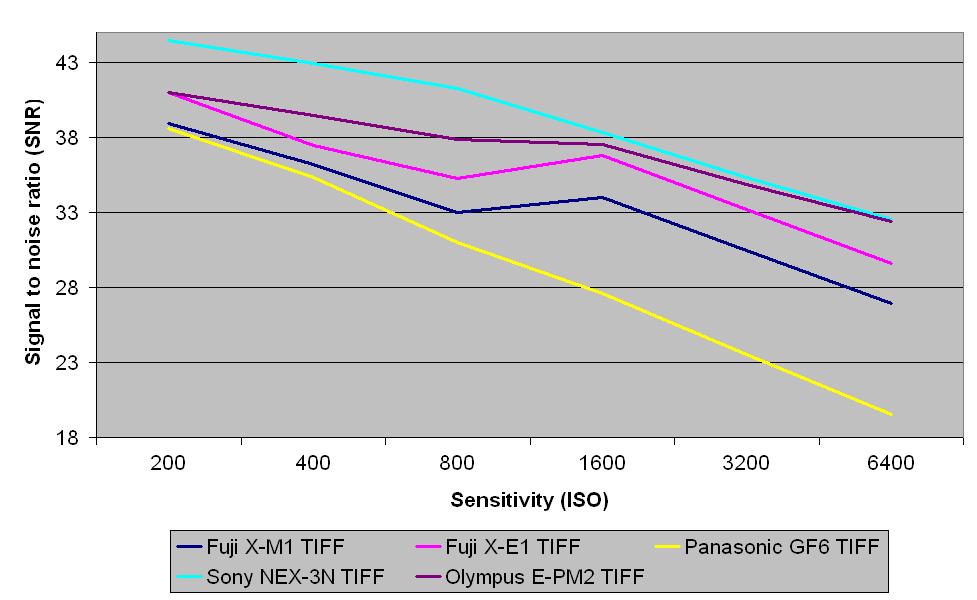
The Fuji X-M1's TIFF images (after conversion from raw) are comparatively weaker than its JPEGs in terms of signal to noise ratios, producing weaker ratios than TIFFs from the Sony NEX-3N, Olympus E-PM2 and Fuji X-E1 at every sensitivity setting. However, the X-M1's TIFFs do contain greater signal to noise ratios than those from the Panasonic GF6 throughout the sensitivity range.
JPEG dynamic range
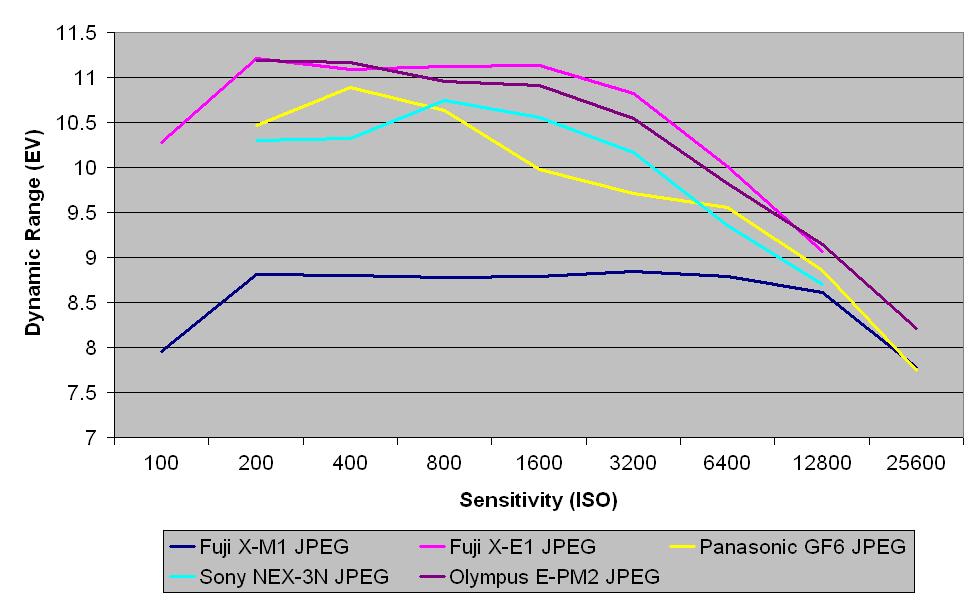
Although the X-M1's JPEG dynamic range appears to be quite poor when compared with other cameras in our labs test this is mostly likely to be due to the level of contrast that Fuji wants in its JPEG images. In our real world testing, we have found that the camera is more than capable of producing images with pleasant contrast and vibrant colours throughout the sensitivity range. Switching to raw shooting produces a dynamic range performance which is much closer to the other cameras on test. The raw files have a significantly wider tonal range that gives greater scope for post capture adjustment, while the JPEGs are intended to look good straight from the camera.
To eliminate any variations, we have tested more than one X-M1 model on several occasions.
Raw dynamic range
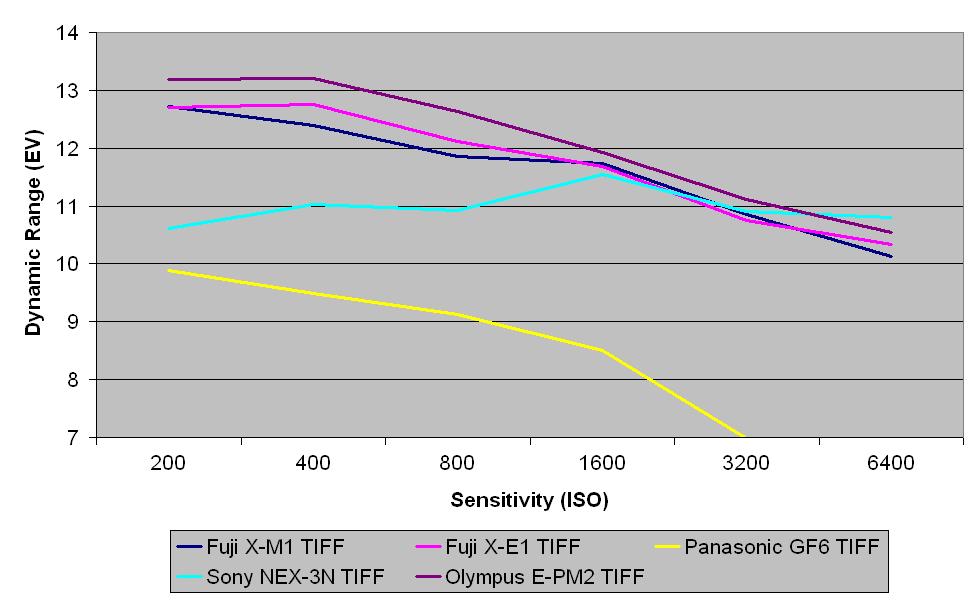
This chart indicates that TIFF images (after conversion from raw) from the Fuji X-M1 contain greater dynamic range than those from the Panasonic GF6 at every sensitivity setting, and greater range than TIFFs from the Sony NEX-3N at every sensitivity except ISO 3200 and 6400. But the Fuji X-M1's TIFFs show weaker dynamic range than the Olympus E-PM2's TIFFs at every sensitivity setting. The Fuji X-M1's TIFFs have a weaker range than the Fuji X-E1's at ISO 400, 800 and 6400, similar range at ISO 200 and 1600, and slightly stronger range at ISO 3200.
Current page: Noise and dynamic range
Prev Page Image quality and resolution Next Page Sample imagesAmy has been writing about cameras, photography and associated tech since 2009. Amy was once part of the photography testing team for Future Publishing working across TechRadar, Digital Camera, PhotoPlus, N Photo and Photography Week. For her photography, she has won awards and has been exhibited. She often partakes in unusual projects - including one intense year where she used a different camera every single day. Amy is currently the Features Editor at Amateur Photographer magazine, and in her increasingly little spare time works across a number of high-profile publications including Wired, Stuff, Digital Camera World, Expert Reviews, and just a little off-tangent, PetsRadar.
