Why you can trust TechRadar
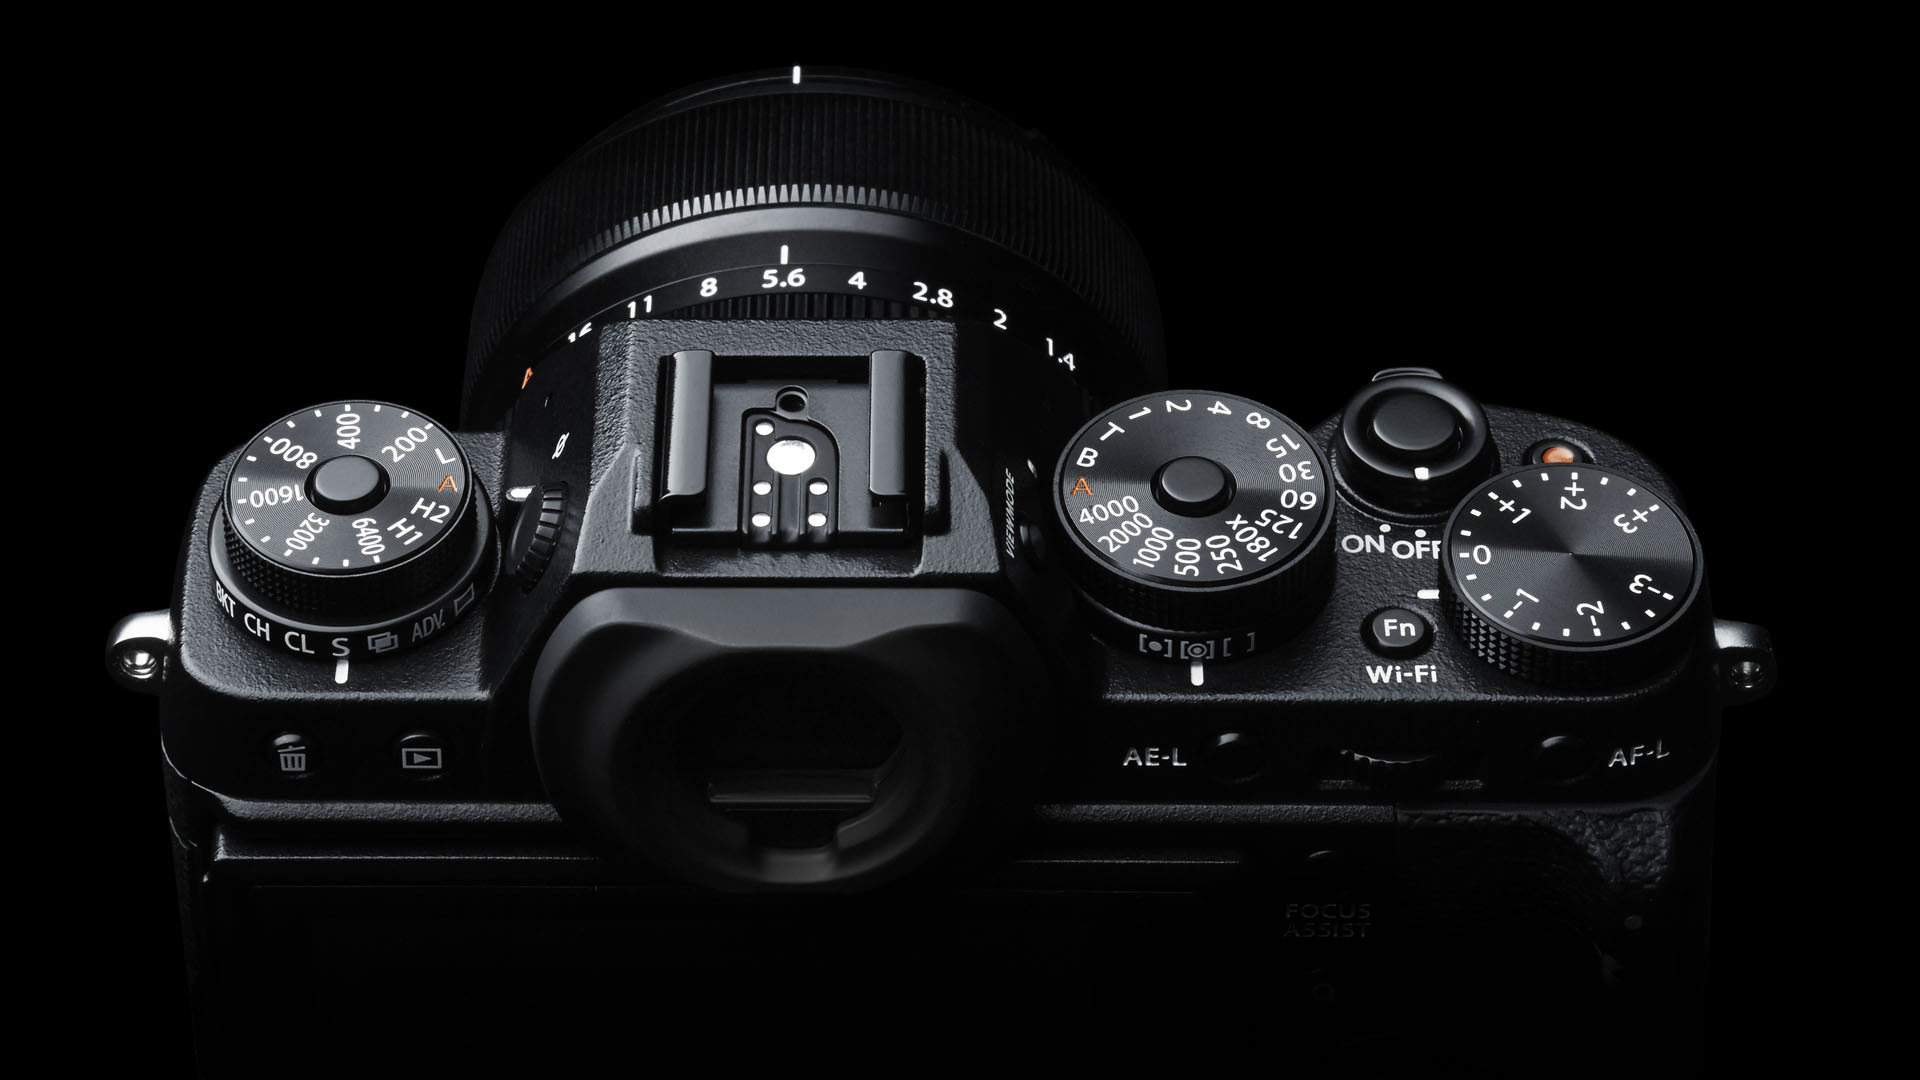
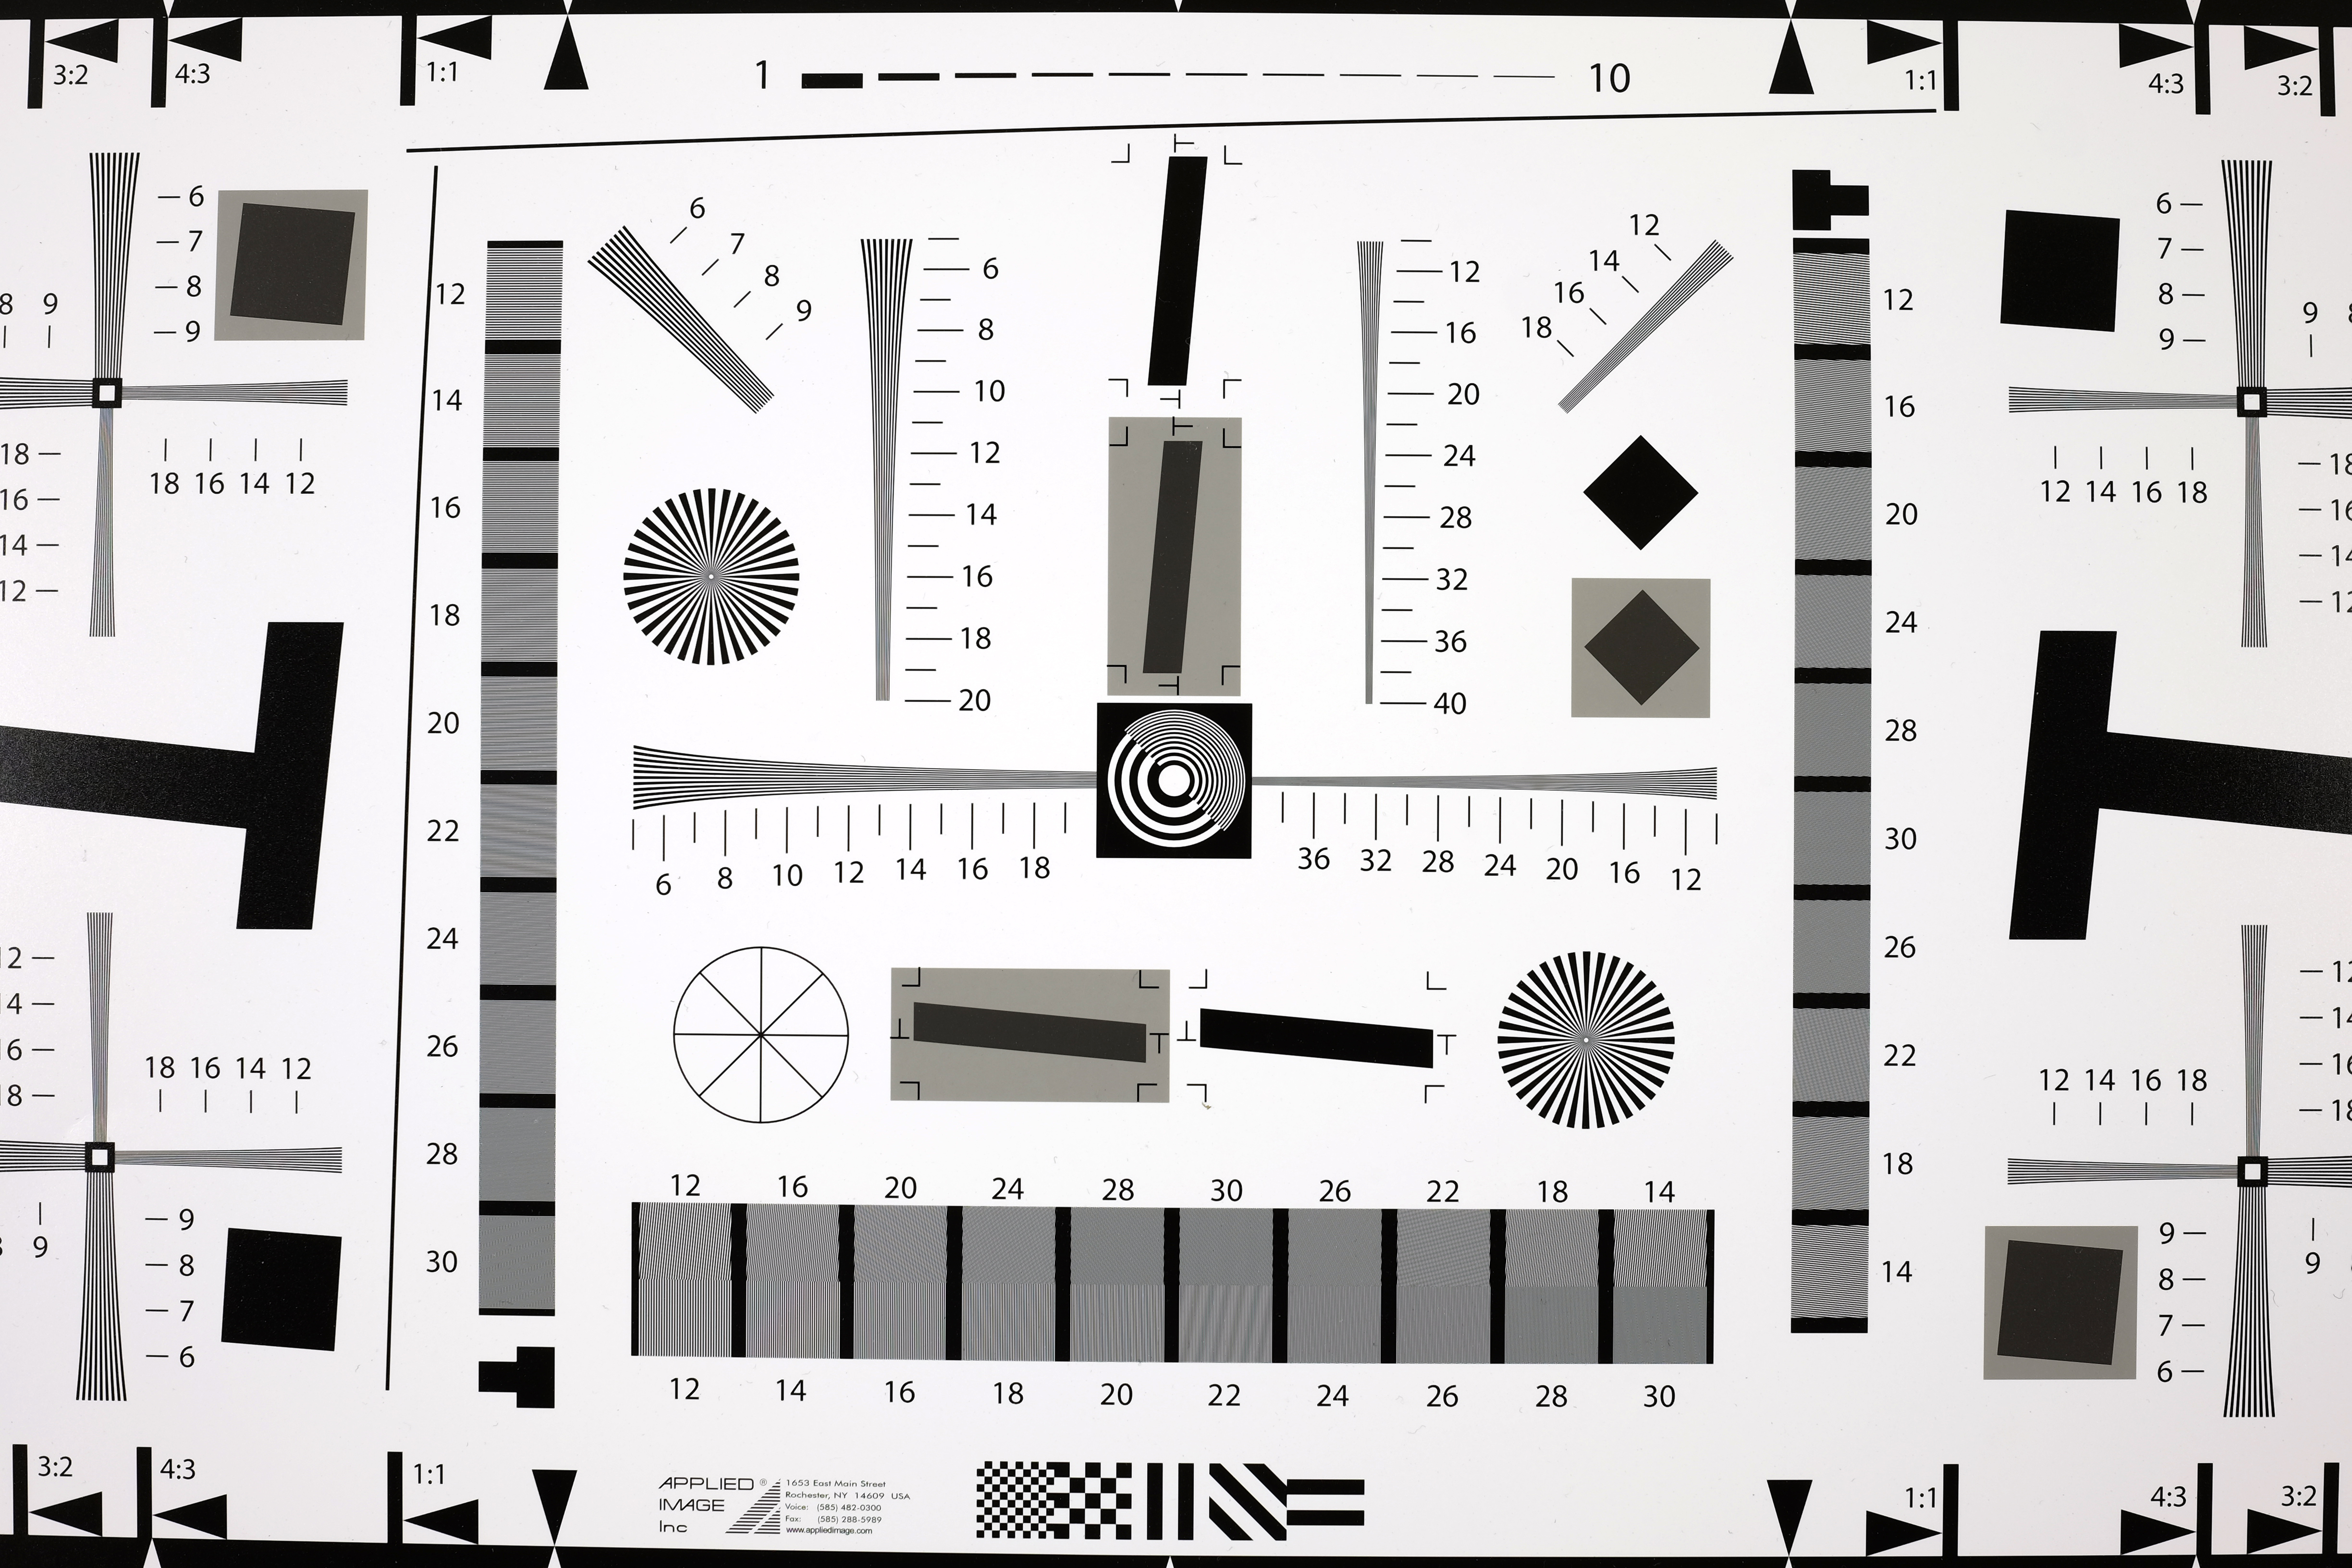
As part of our image quality testing for the Fuji X-T1 review, we've shot our resolution chart. These images were captured using a full-production sample of the camera.
If you view our crops of the resolution chart's central section at 100% (or Actual Pixels) you will see that, for example, at ISO 100 the Fuji X-T1 achieves a score of 28 (line widths per picture height x100) in its highest quality JPEG files.
For a full explanation of what our resolution charts mean, and how to read them, check out our full explanation of our camera testing resolution charts.
Examining images of the chart taken at each sensitivity setting reveals the following resolution scores in line widths per picture height x100:
JPEG
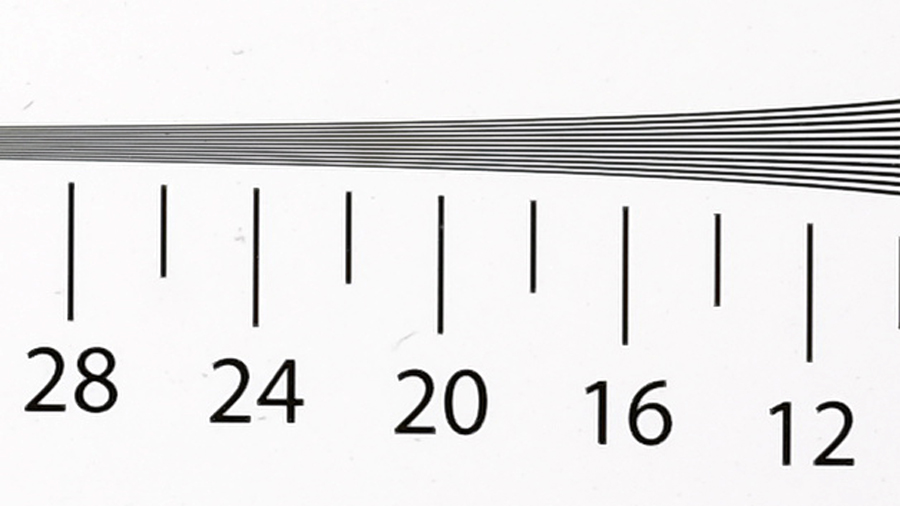
ISO 100 Score: 28 Click here for full-resolution image.
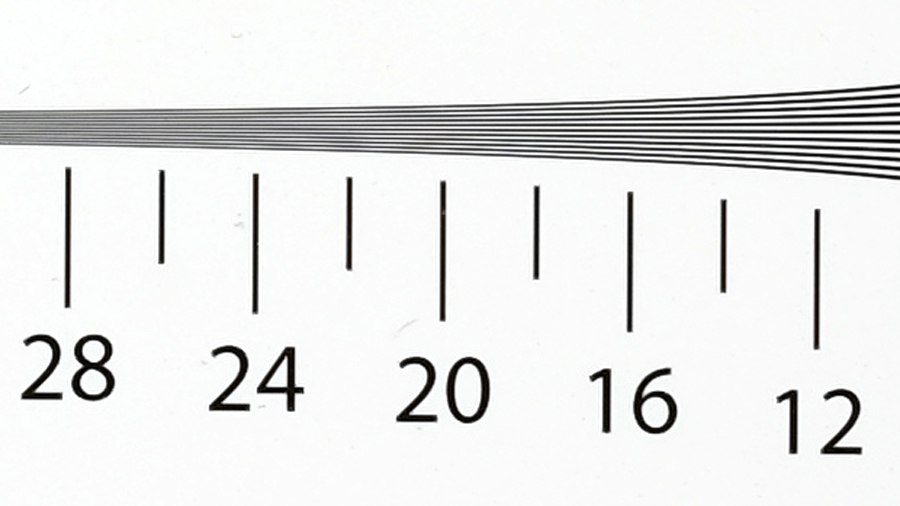
ISO 200 Score: 28 Click here for full-resolution image.
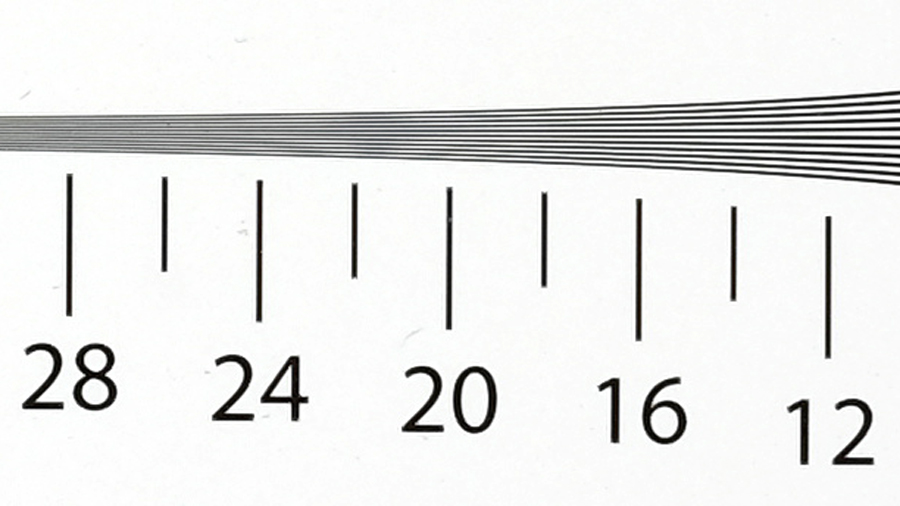
ISO 400 Score: 26 Click here for full-resolution image.
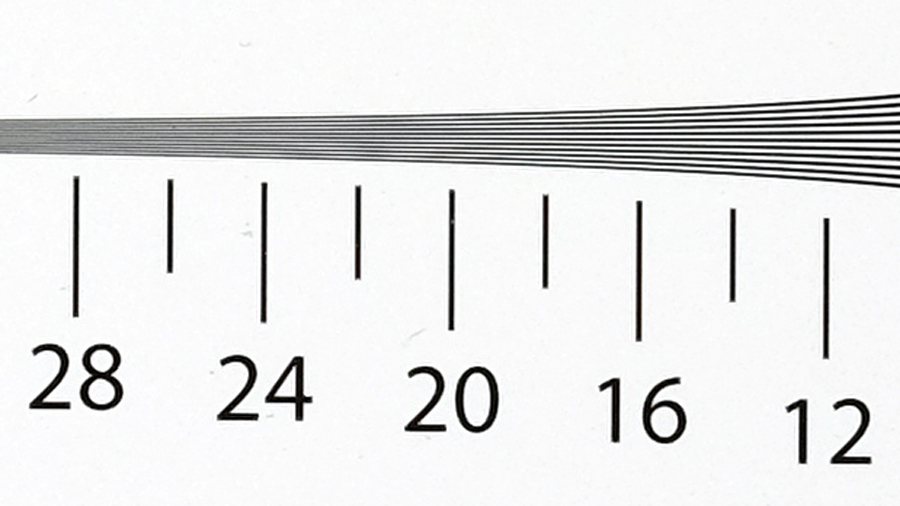
ISO 800 Score: 26 Click here for full-resolution image.
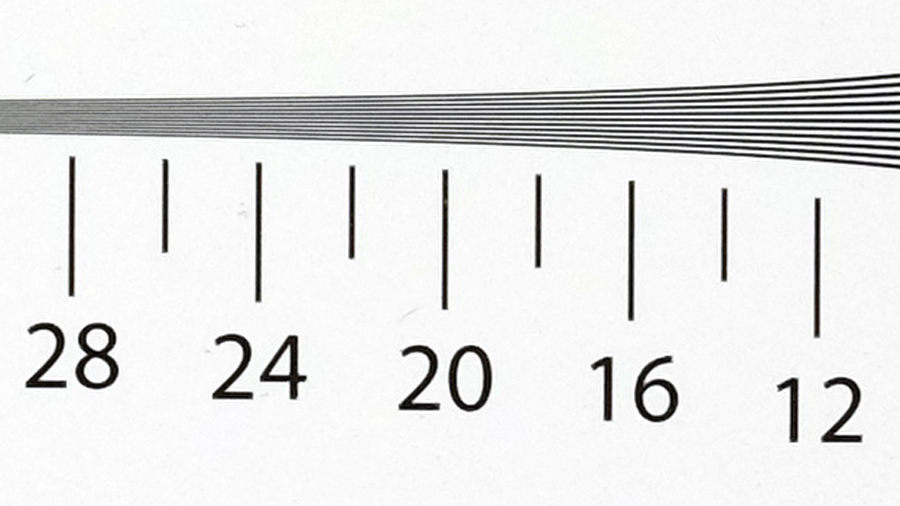
ISO 1600 Score: 26 Click here for full-resolution image.
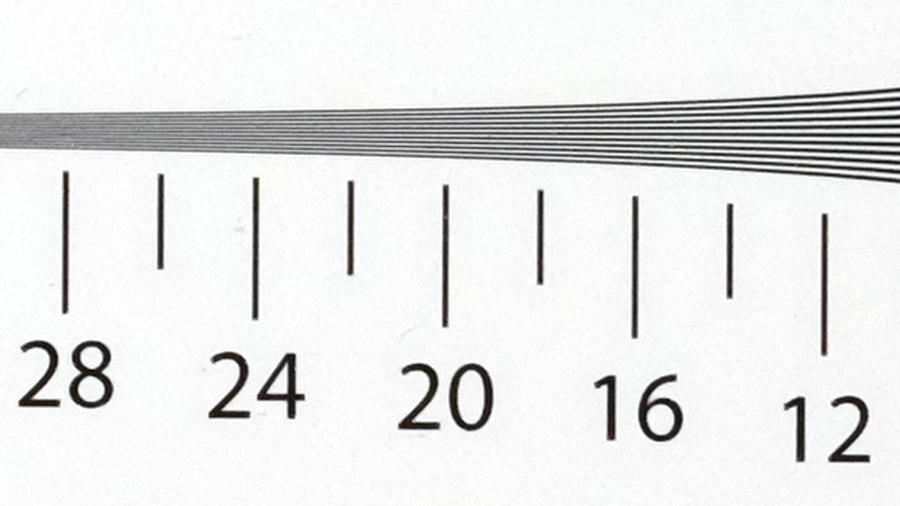
ISO 3200 Score: 24 Click here for full-resolution image.
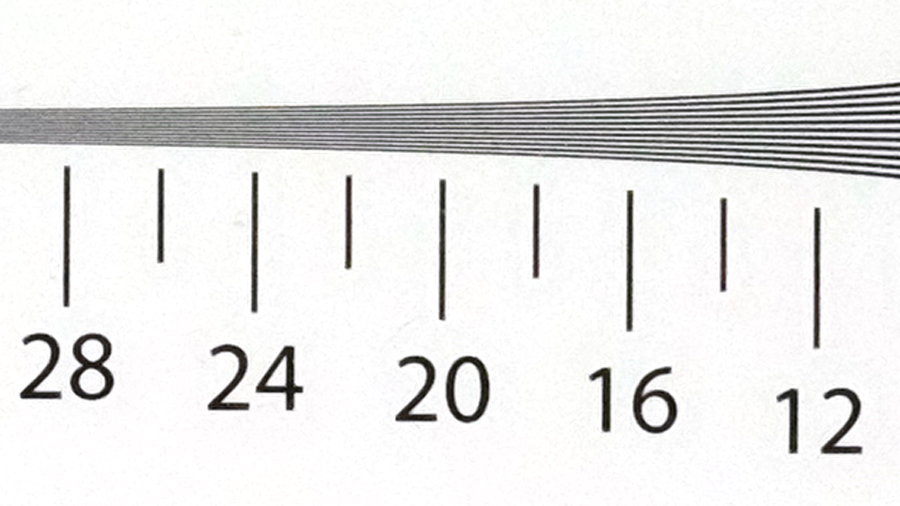
ISO 6400 Score: 24 Click here for full-resolution image.
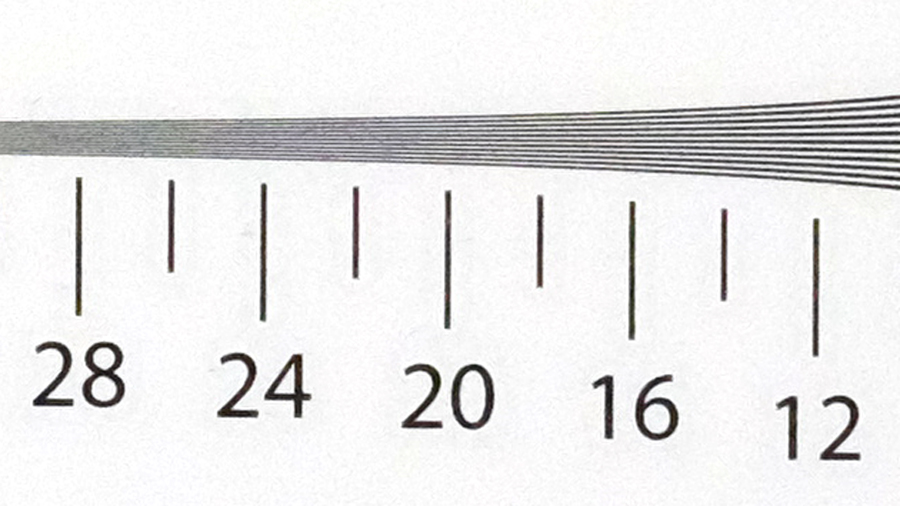
ISO 12,800 Score: 24 Click here for full-resolution image.
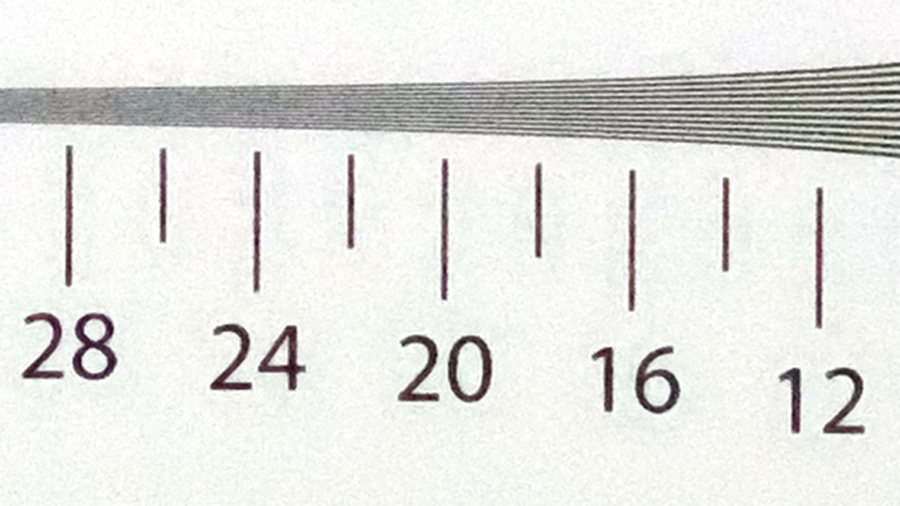
ISO 25,600 Score: 22 Click here for full-resolution image.
Raw
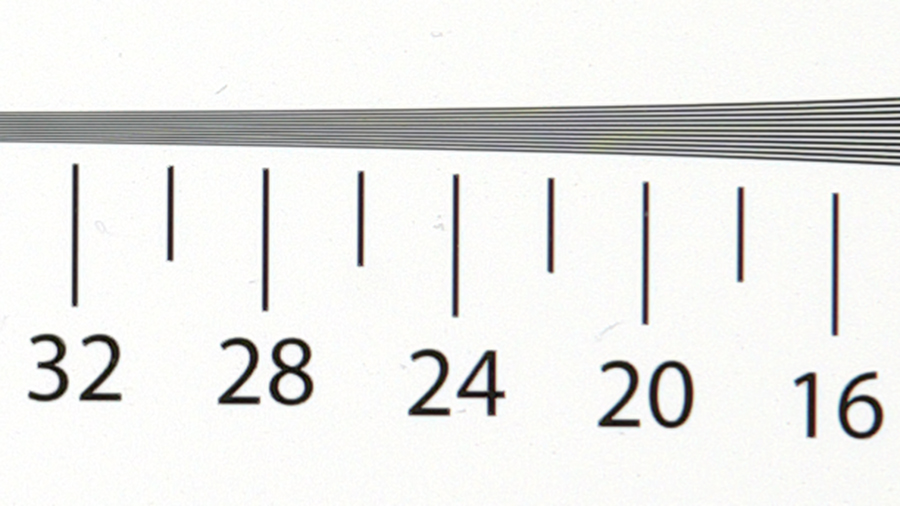
ISO 200 Score: 32 Click here for full-resolution image.
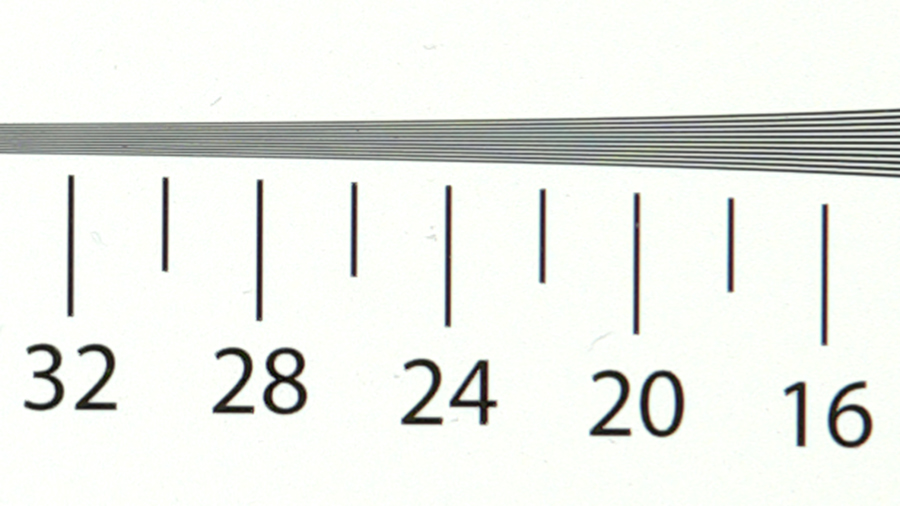
ISO 400 Score: 32 Click here for full-resolution image.
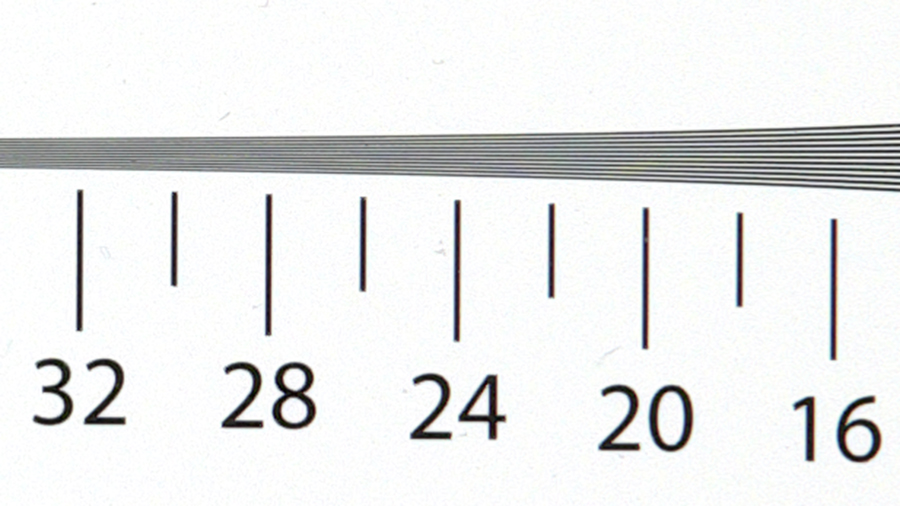
ISO 800 Score: 32 Click here for full-resolution image.
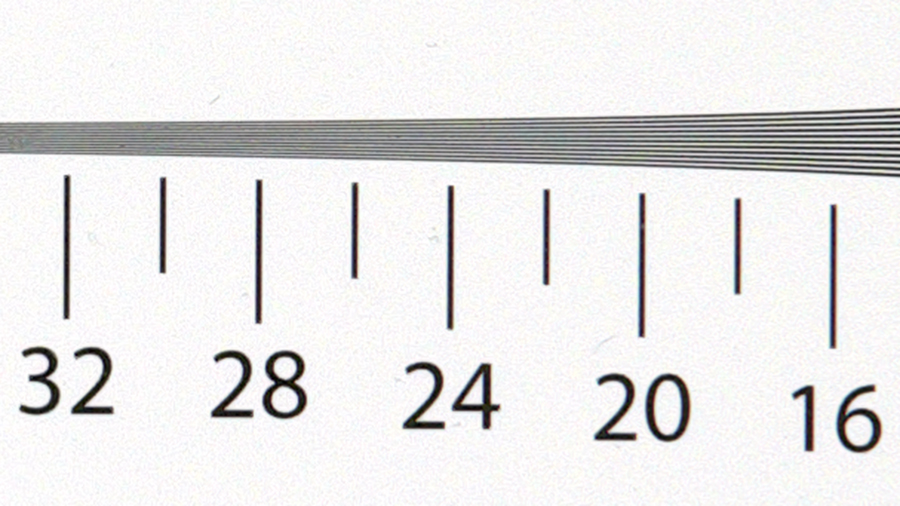
ISO 1600 Score: 30 Click here for full-resolution image.
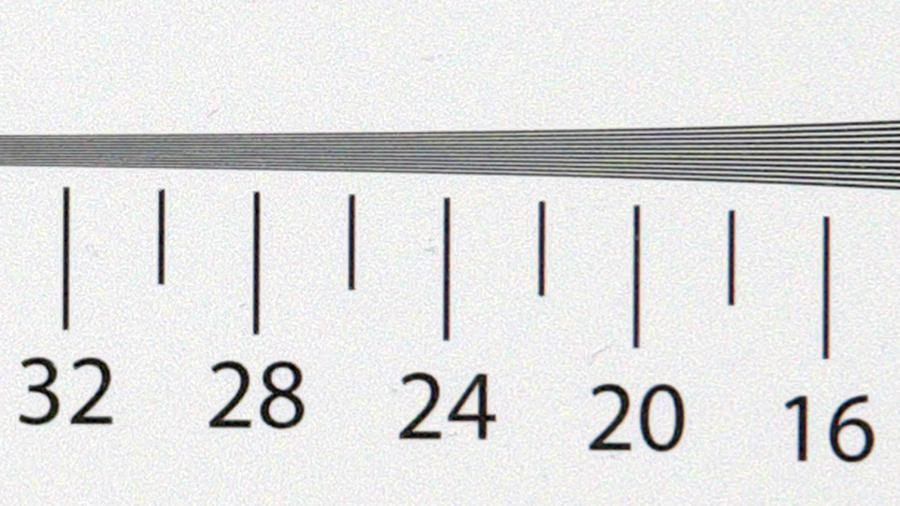
ISO 3200 Score: 28 Click here for full-resolution image.
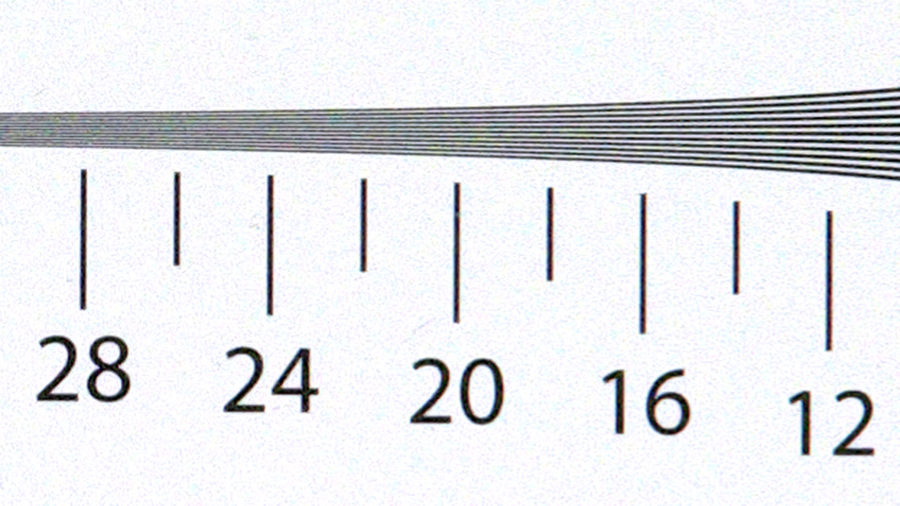
ISO 6400 Score: 28 Click here for full-resolution image.
The TechRadar hive mind. The Megazord. The Voltron. When our powers combine, we become 'TECHRADAR STAFF'. You'll usually see this author name when the entire team has collaborated on a project or an article, whether that's a run-down ranking of our favorite Marvel films, or a round-up of all the coolest things we've collectively seen at annual tech shows like CES and MWC. We are one.
