Why you can trust TechRadar
We shoot a specially designed chart in carefully controlled conditions and the resulting images are analysed using DXO Analyzer software to generate the data to produce the graphs below.
A high signal to noise ratio (SNR) indicates a cleaner and better quality image.
For more more details on how to interpret our test data, check out our full explanation of our noise and dynamic range tests.
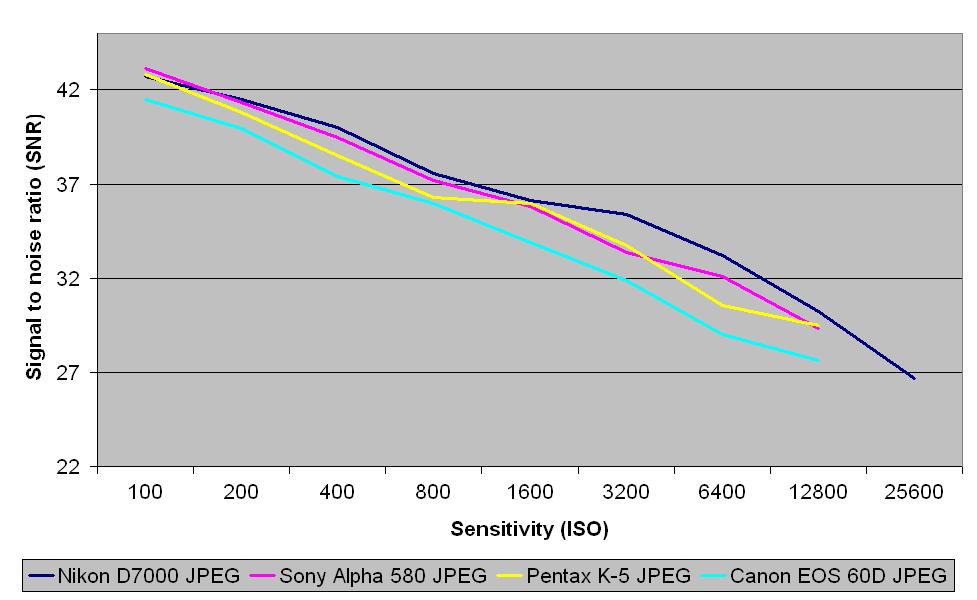
JPEG images from the Nikon D7000 closely relate to those from the Sony Alpha 580, Pentax K-5 and Canon EOS 60D. But from ISO 200 the Nikon D7000 just has the edge over the other cameras.
Raw images
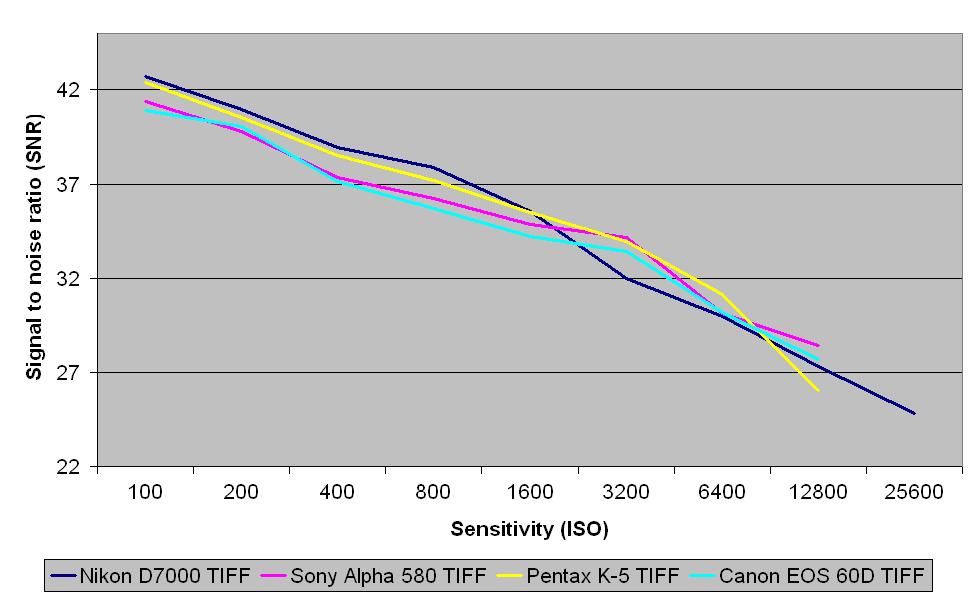
TIFF images (after conversion for raw) from the D7000 are on par with those from the Sony Alpha 580, Pentax K-5 and Canon EOS 60D. At the lower end of the sensitivity scale up to ISO 1600 the Nikon D7000 shows a better signal to noise ratio result than the other cameras.
Dynamic range
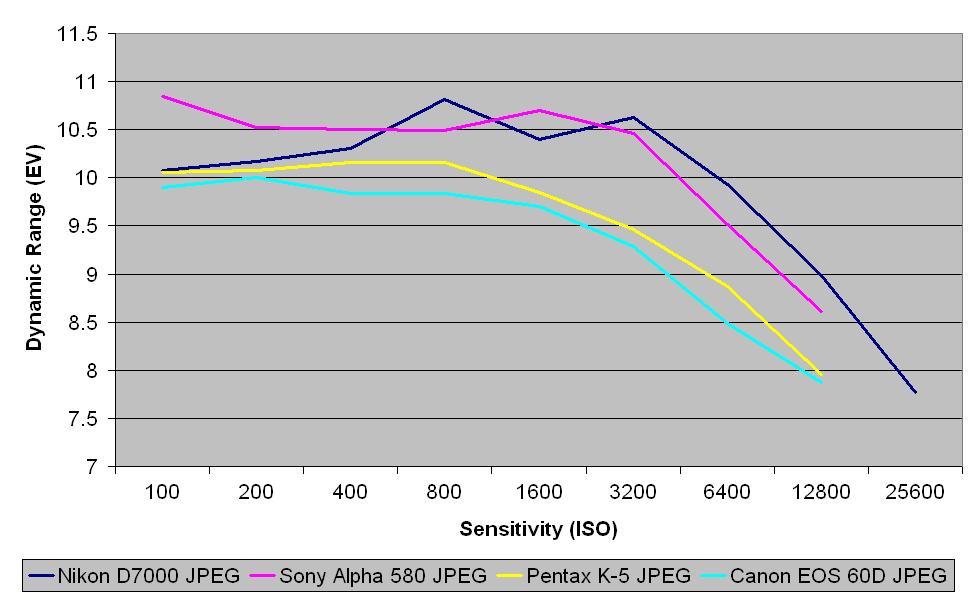
This chart indicates that the JPEG dynamic range results from the Nikon D7000 and Sony Alpha 580 relate closely across the sensitivity range, beating both the Pentax K-5 and Canon EOS 60D.
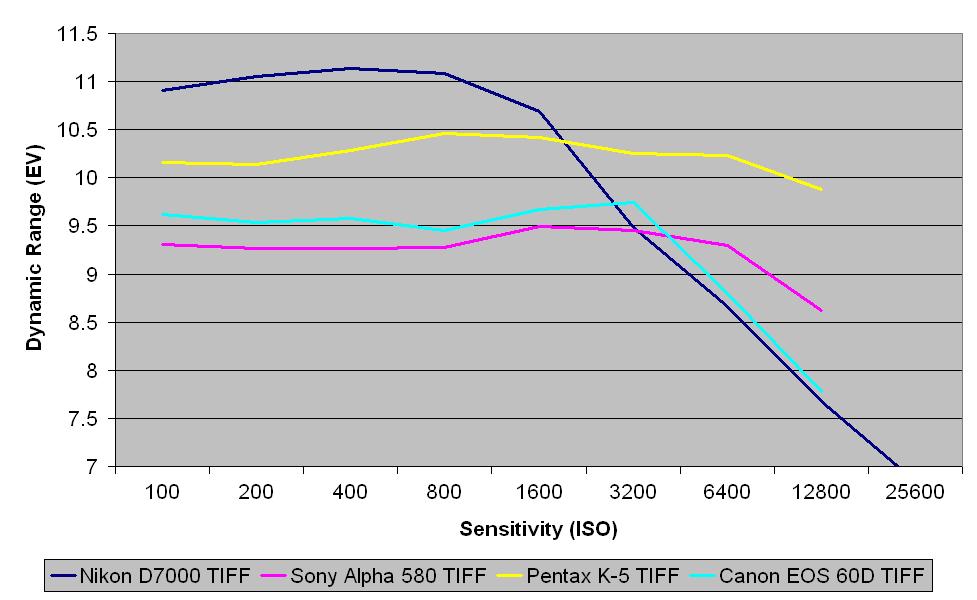
TIFF images (after conversion from raw) from the Nikon D7000 capture a wide tonal range at sensitivities upto ISO 1600, beating the Sony Alpha 580, Pentax K-5 and Canon EOS 60D. However as the sensitivity increases the dynamic range results drop dramatically from ISO 3200.
Current page: Noise and dynamic range
Prev Page Resolution Next Page Nikon D7000 V D90 and Canon EOS 60D