Why you can trust TechRadar
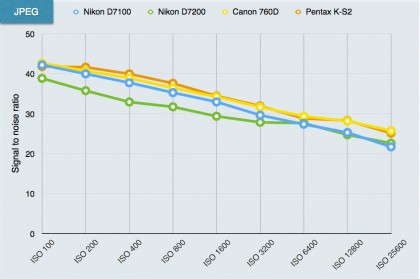
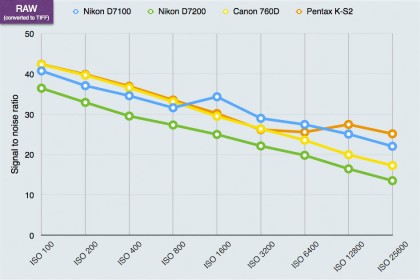
The signal to noise ratio data shows how much of the camera's image is made up of real image data and how much is random noise. The higher the signal to noise ratio figure, the better, because this means the image exhibits less noise.
Nikon D7100 signal to noise ratio charts

JPEG signal to noise ratio analysis: The D7100's results are very close to those of the newer Canon 760D and Pentax K-S2, which is a creditable performance for an older camera. Interestingly, the D7200's figures are a good deal lower. This suggests that Nikon has modified the image processing to favour resolution over noise – this seems to be borne out by its unusually high resolution results. Many photographers would probably accept more noise if it meant sharper detail.

Raw (converted to TIFF) signal to noise ratio analysis: This pattern is repeated with raw files – the D7100 competes well with the Canon 760D and Pentax K-S2, while the D7200 lags a little behind.
Current page: Lab tests: Signal to noise ratio
Prev Page Lab tests: Dynamic range Next Page Sample imagesThe TechRadar hive mind. The Megazord. The Voltron. When our powers combine, we become 'TECHRADAR STAFF'. You'll usually see this author name when the entire team has collaborated on a project or an article, whether that's a run-down ranking of our favorite Marvel films, or a round-up of all the coolest things we've collectively seen at annual tech shows like CES and MWC. We are one.
