Why you can trust TechRadar
These graphs were produced using data generated by DXO Analyzer.
We shoot a specially designed chart in carefully controlled conditions and the resulting images are analysed using the DXO software.
Signal to noise ratio
A high signal to noise ratio (SNR) indicates a cleaner and better quality image.
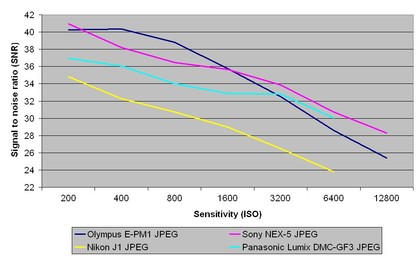
JPEG images from the Olympus E-PM1 shows good signal to noise ratio results up to a sensitivity of ISO 1600. Above this sensitivity both the Sony NEX-5 and Pansonic Lumix DMC-GF3 show less noise in the images, and from ISO 6400 noise can become a real issue.
Raw signal to noise ratio
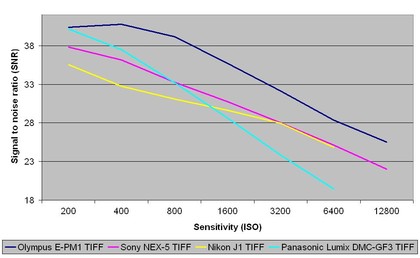
Raw images (after conversion to TIFF) from the Olympus E-PM1 shows a better signal to noise ratio across the sensitivity range than Sony NEX-5, Nikon J1 and Panasonic Lumix DMC-GF3.
For a full explanation of what our resolution charts mean, and how to read them please click here to read the full article.
Dynamic range
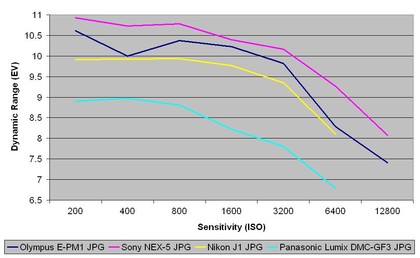
This chart indicates that the Olympus E-PM1's JPEGs show impressive dynamic range results up to a sensitivity of ISO 3200, only just beaten by the Sony NEX-5.
Raw dynamic range
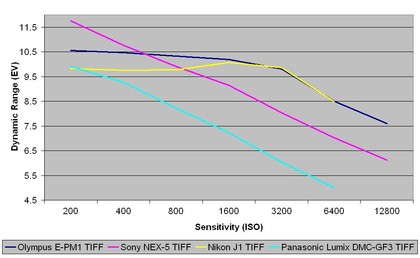
This chart indicates that the Olympus E-PM1's RAW images (after conversion to TIFF) show that it can resolve a good amount of shadow and highlight detail across the sensitivity range, and compare well against the Nikon J1.
For more more details on how to interpret our test data, check out our full explanation of our noise and dynamic range tests.
