Why you can trust TechRadar
We shoot a specially designed chart in carefully controlled conditions, and the resulting images are analysed using DXO Analyzer software to generate the data to produce the graphs below.
A high signal to noise ratio (SNR) indicates a cleaner and better quality image.
For more more details on how to interpret our test data, check out our full explanation of our noise and dynamic range tests.
JPEG noise and dynamic range
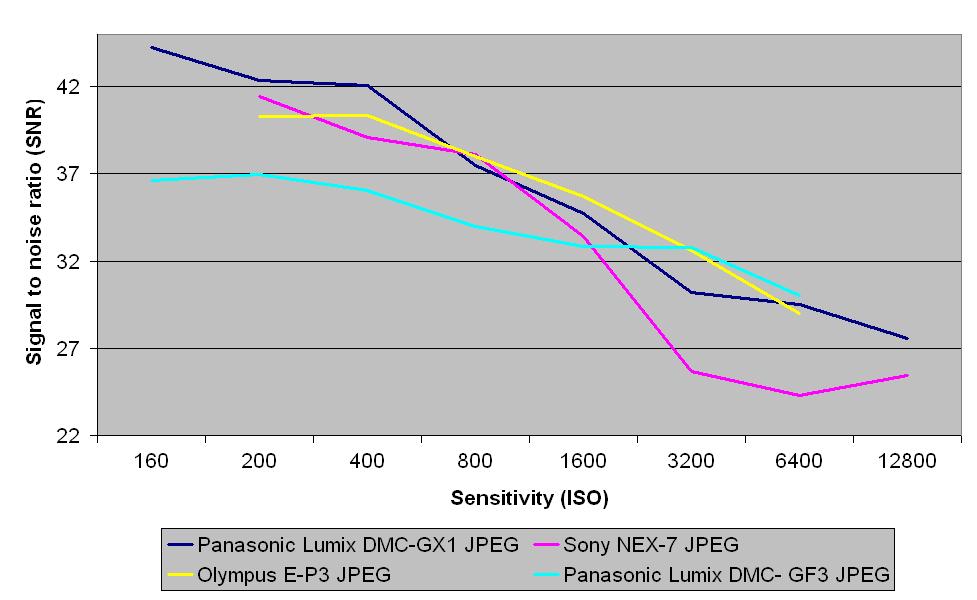
Up to a sensitivity of ISO 800, JPEG images from the Panasonic Lumix DMC-GX1 beat the Sony NEX-7, Olympus E-P3 and Panasonic Lumix DMC-GF3. Although the Olympus E-P3 just takes the lead from ISO 800, the difference in results is marginal.
Raw images
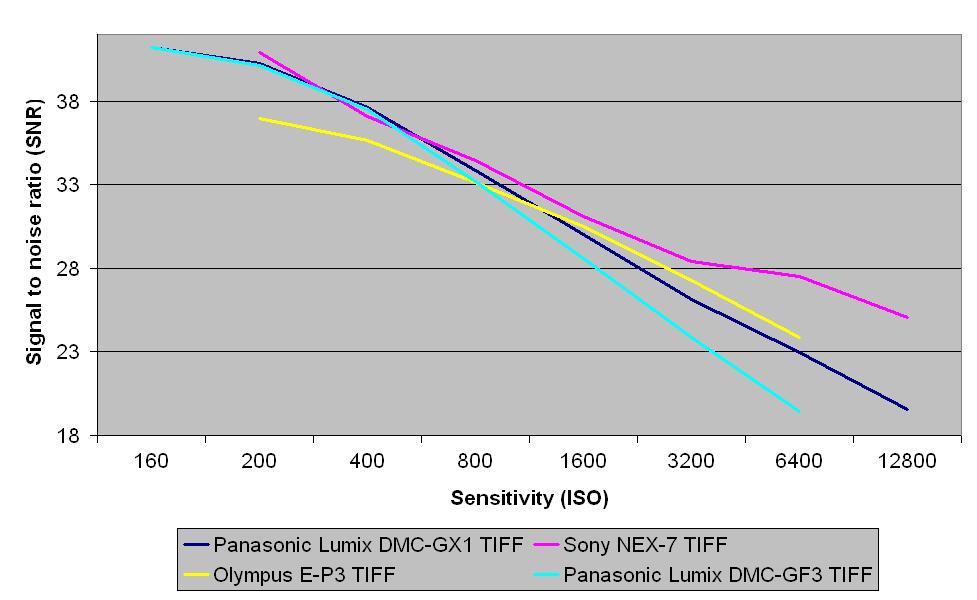
Raw files (after conversion to TIFF) from the Panasonic Lumix DMC-GX1are on par with the Sony NEX-7, Olympus E-P3 and Panasonic Lumix DMC-GF3. At the higher end of the sensitivity range the GX1 shows a slight improvement over the GF3, but the Sony NEX-7 leads in this area.
JPEG dynamic range
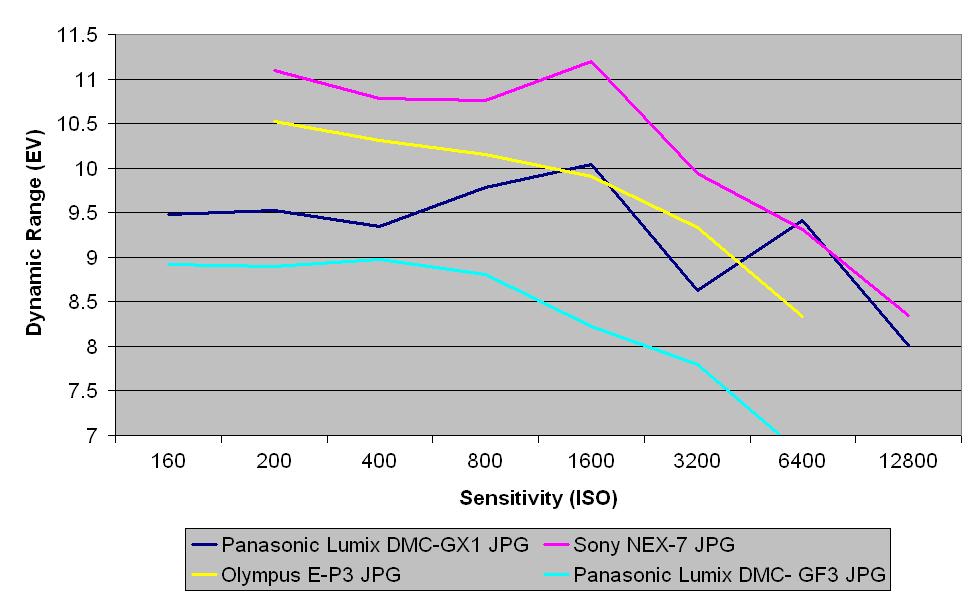
This chart indicates that the Panasonic Lumix DMC-GX1's JPEGs show an improvement over the Panasonic Lumix DMC-GF3, but they lag behind those from the Sony NEX-7 and Olympus E-P3 especially at the lower end of the sensitivity range.
Raw dynamic range
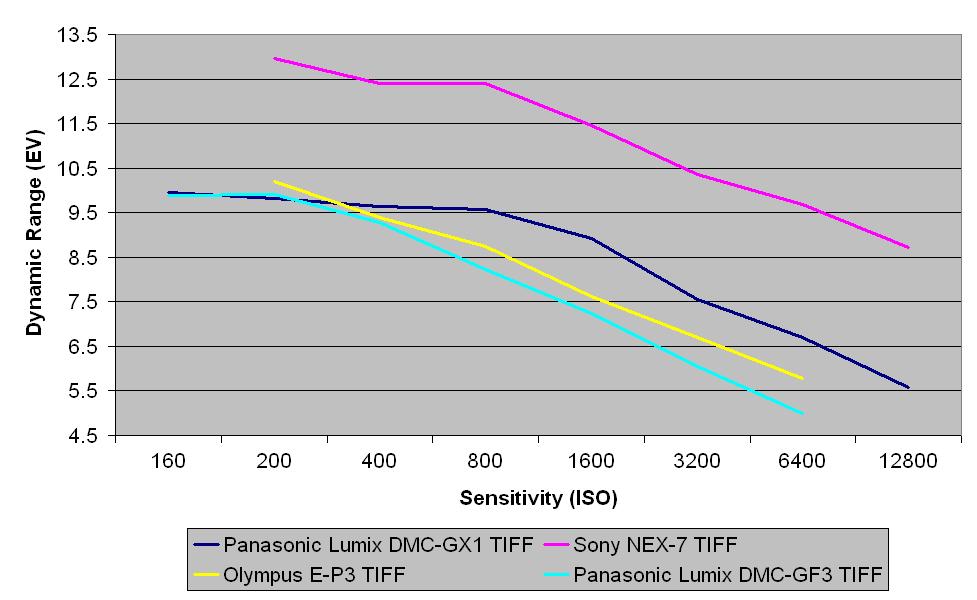
TIFF images (after conversion from raw) from the Panasonic Lumix DMC-GX1 compare well against those from the Olympus E-P3. They show a definate improvement over the Panasonic DMC-GF3. However, the more expensive Sony NEX-7 really shows its quality with dynamic range scores that are at least 1.5 EV higher across the dynamic range
Sign up for breaking news, reviews, opinion, top tech deals, and more.
Current page: Noise and dynamic range
Prev Page Image quality and resolution Next Page Sample images