Why you can trust TechRadar
For a full explanation of what our resolution charts mean, and how to read them please click here to read the full article.
Resolution charts
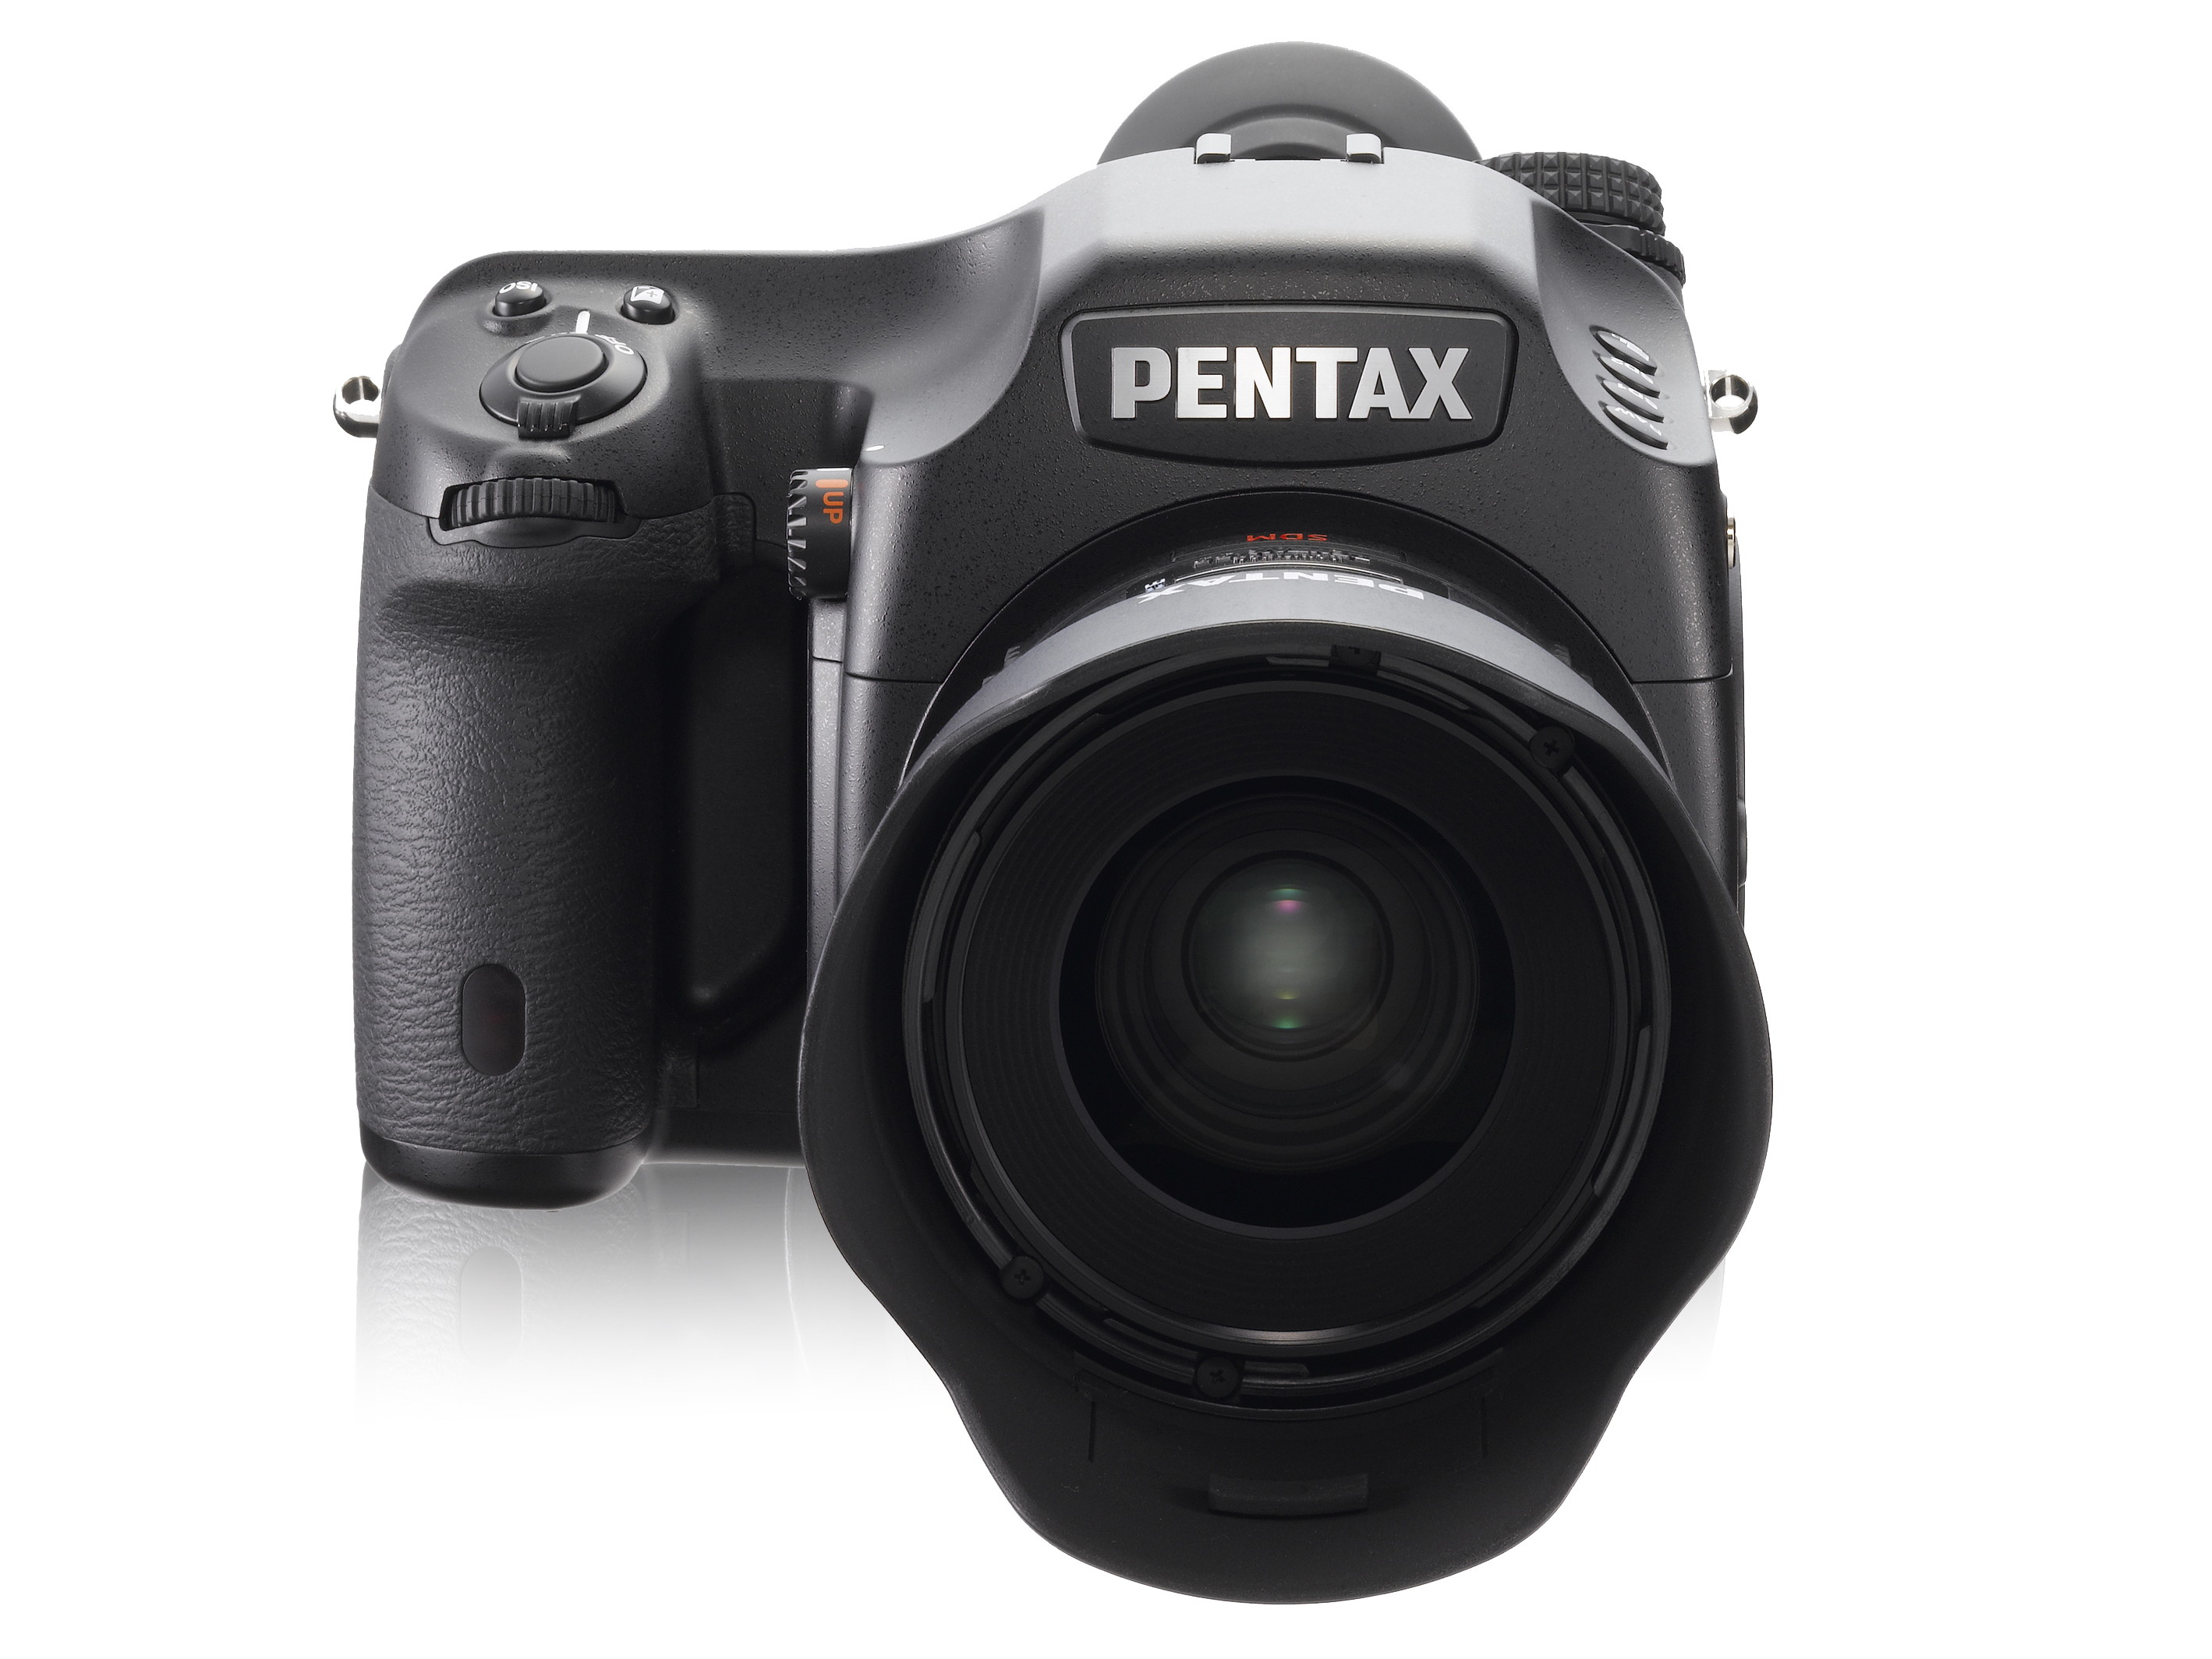
As part of our image quality testing for the Pentax 645D, we've shot our resolution chart with a Pentax smc D-FA 645 55mm f/2.8 lens mounted.
However if you're wondering why you'd pay the extra for the Pentax 645D, you only have to look at the results for resolution across the sensitivity range. The resolution results at ISO 200 for the Pentax 645D are a staggering 3,600 LW / PH, close to the maximum possible for our charts, compare this to the Nikon D3x's at a still impressive 2,800 LW / PH and the Canon EOS 1Ds MK III's at 2,600, and you can instantly see the benefits of the 40MP medium format sensor*.
* Pentax 645D sensor size 44mm x 33mm, True medium format 50.7mm x 39mm, full frame 36mm x 24mm
Reading the charts
If you view our crops of the resolution chart's central section at 100% (or Actual Pixels) you will see that, for example, at ISO 100 the Pentax 645D is capable of resolving up to around 32 (line widths per picture height x100) in its highest quality JPEG files. However, this rises to 36 (line widths per picture height x100) at ISO 200 and above.
Examining images of the chart taken at each sensitivity setting reveals the following resolution scores in line widths per picture height x100:
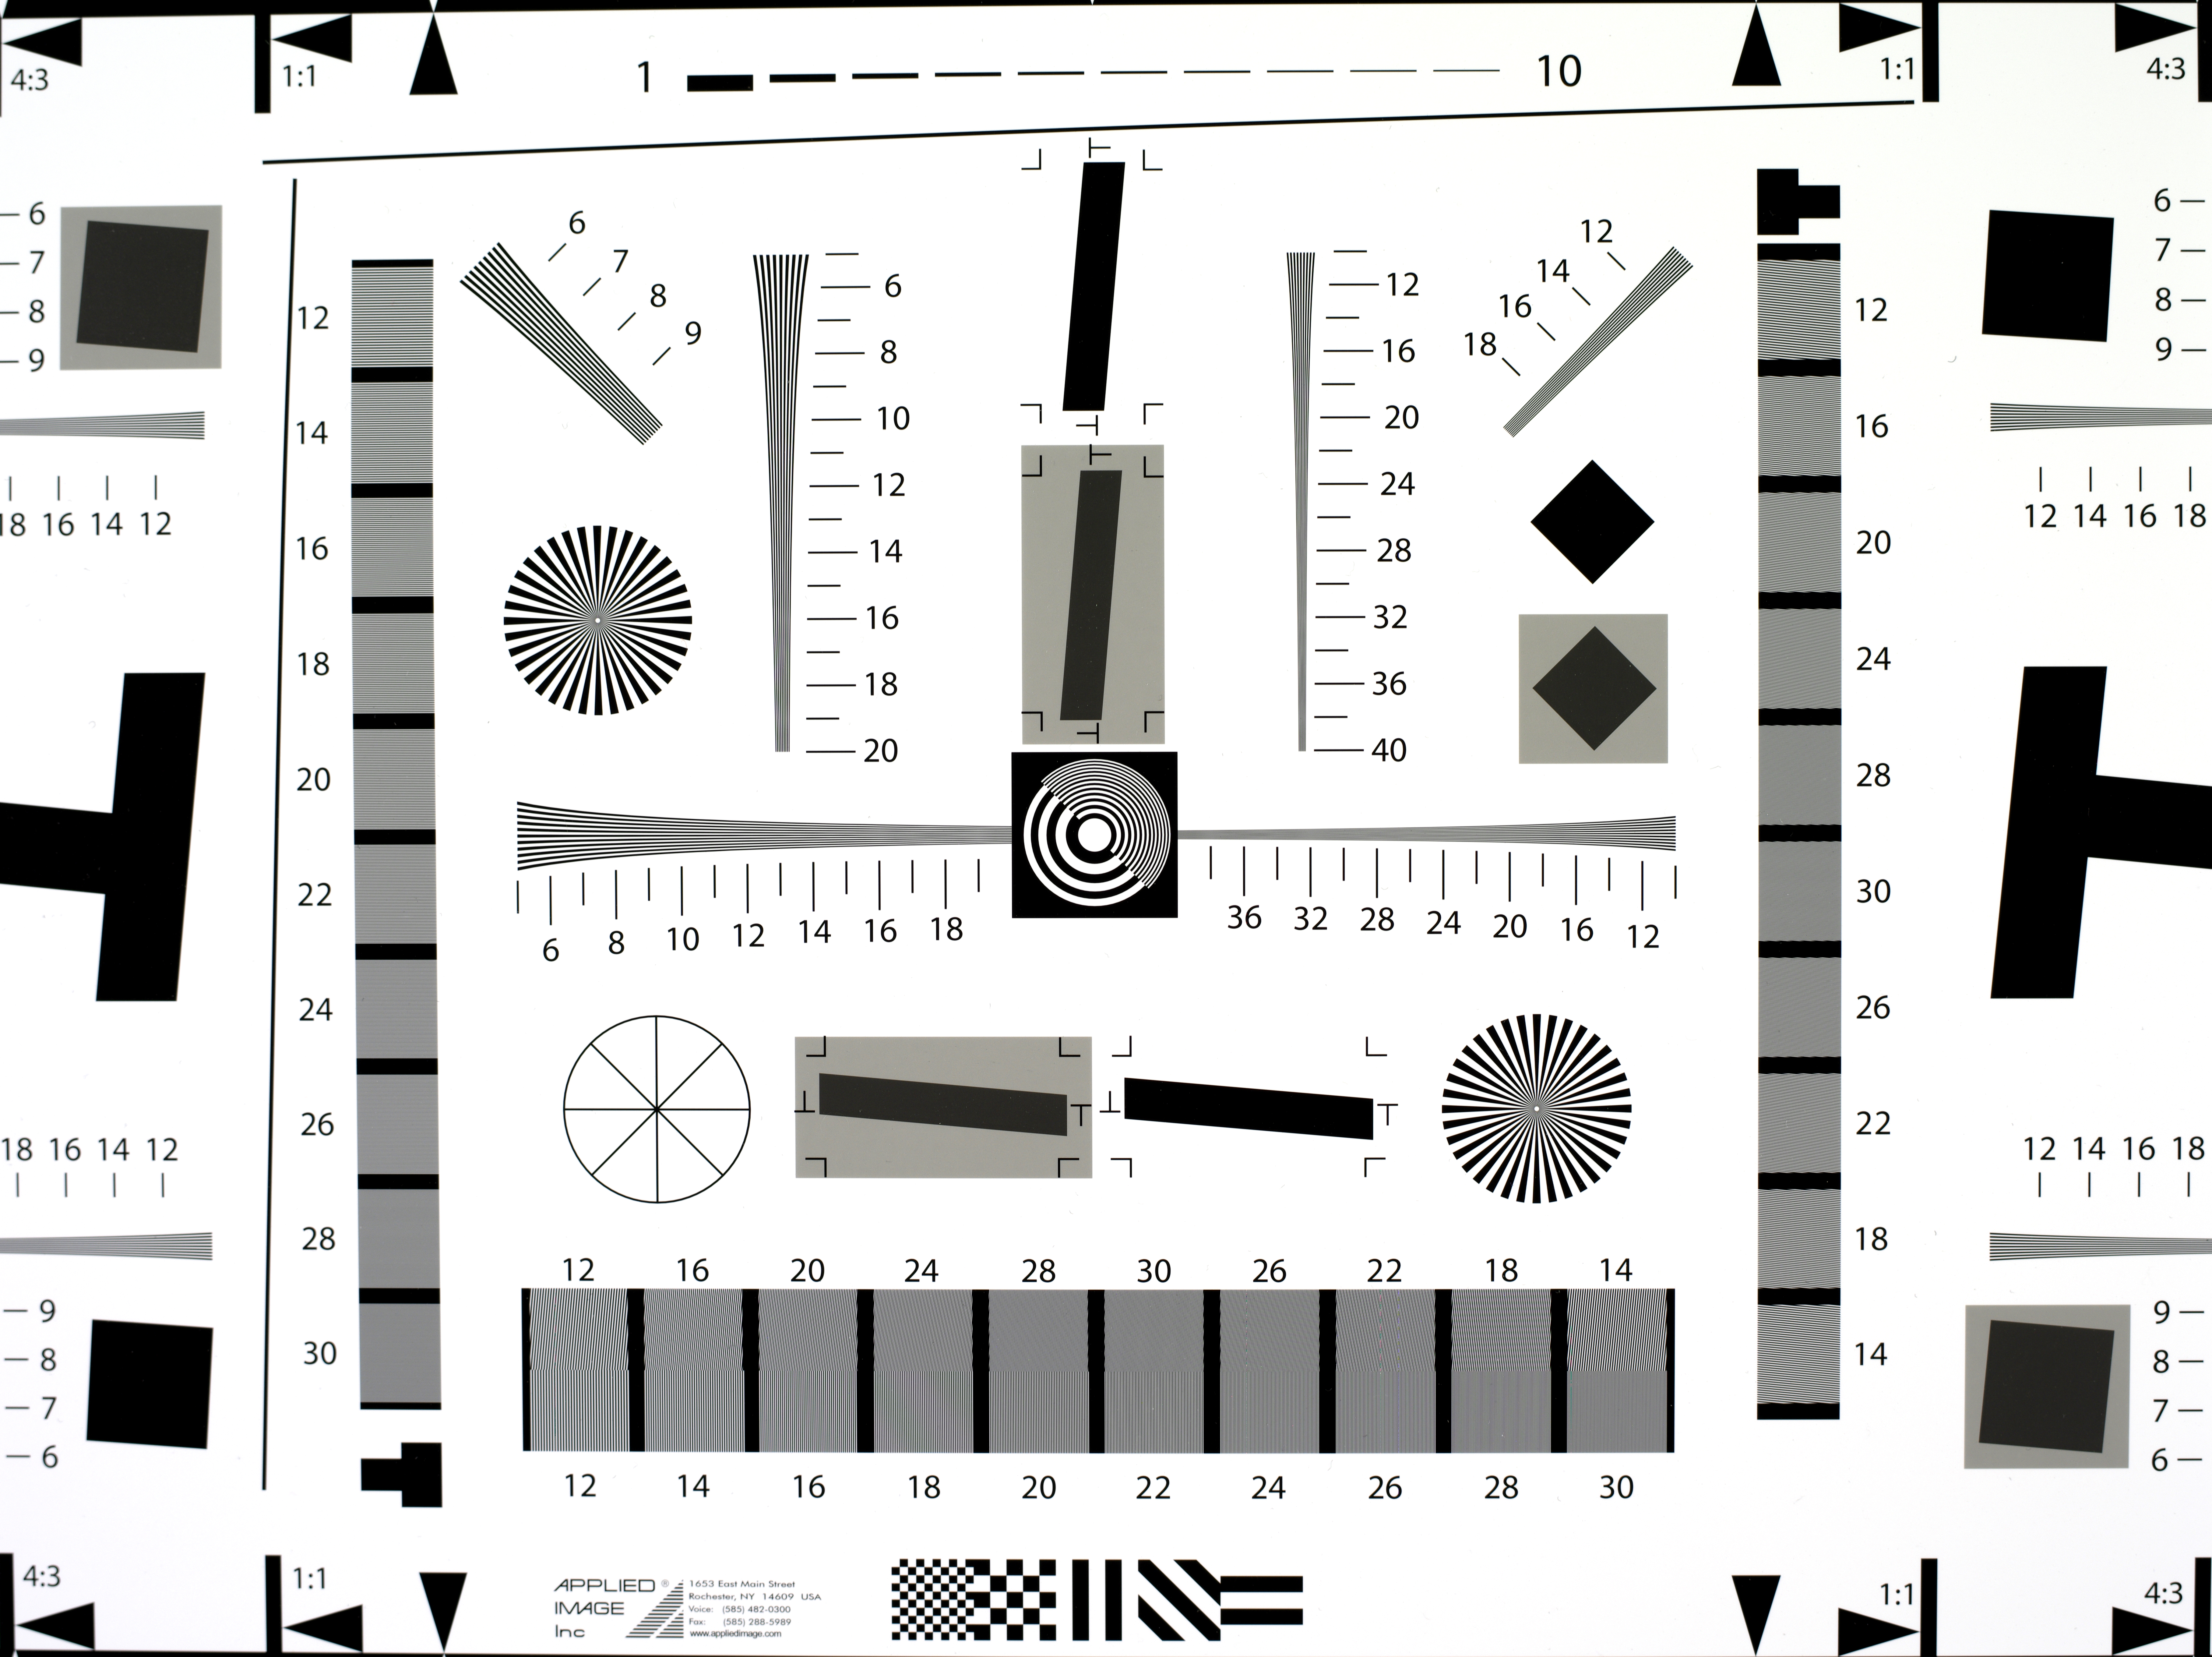
JPEG resolution
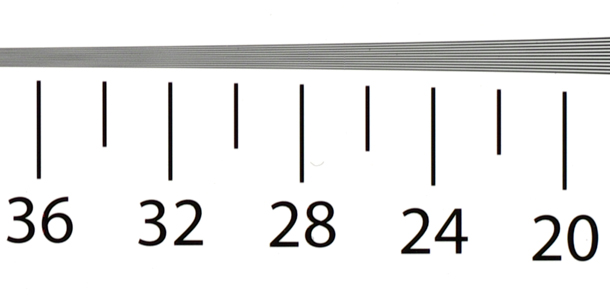
ISO 100, score: 32 (see full image)
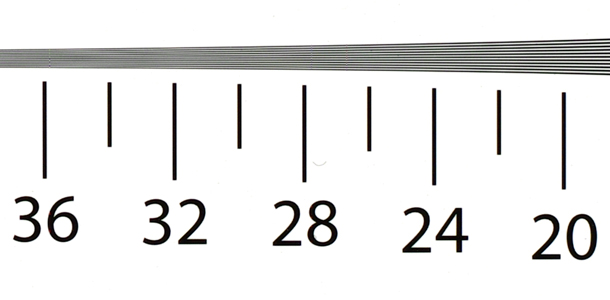
ISO 200, score: 36 (see full image)
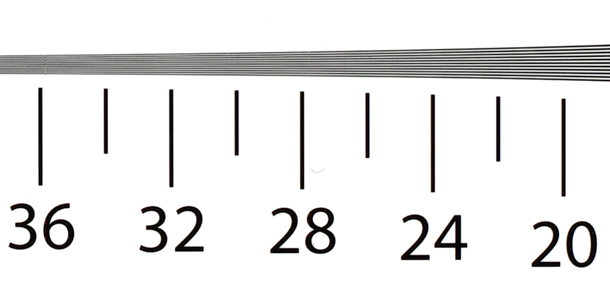
ISO 400, score: 36 (see full image)
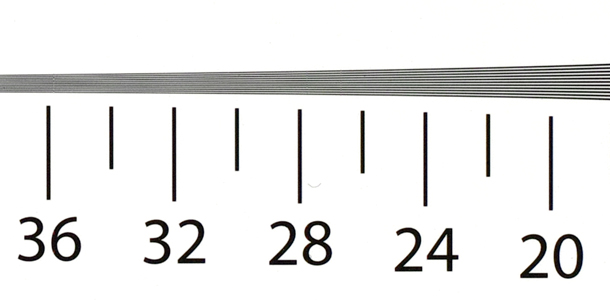
ISO 800, score: 36 (see full image)
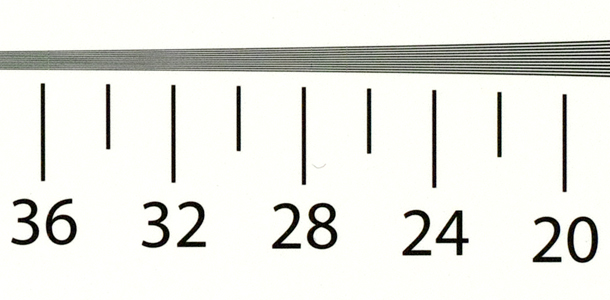
ISO 1600, score: 36 (see full image)
Raw resolution
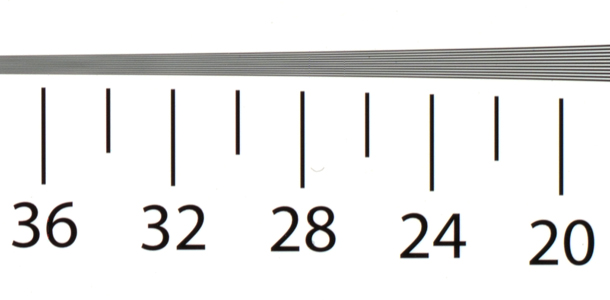
ISO 100, score: 32 (see full image)
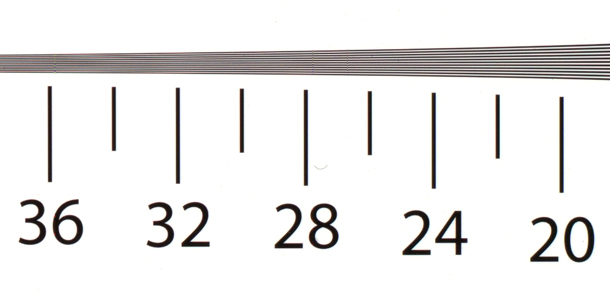
ISO 200, score: 36 (see full image)
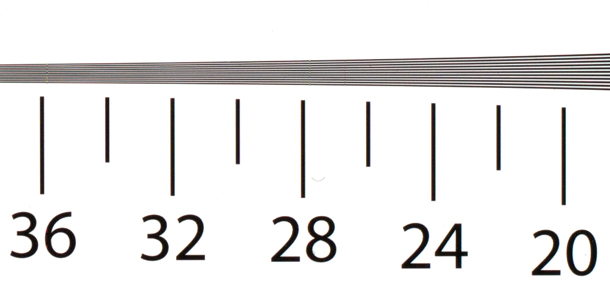
ISO 400, score: 36 (see full image)
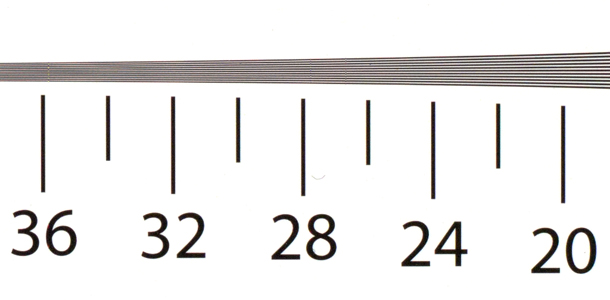
ISO 800, score: 36 (see full image)
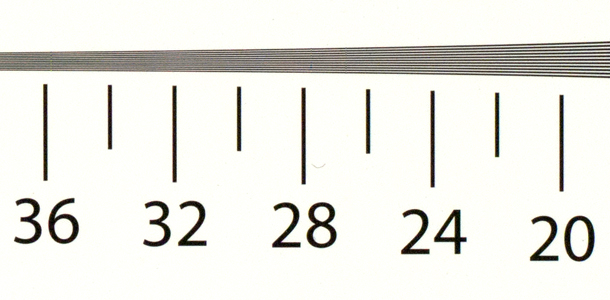
ISO 1600, score: 36 (see full image)
