Why you can trust TechRadar
These graphs were produced using data generated by DXO Analyzer.
We shoot a specially designed chart in carefully controlled conditions and the resulting images are analysed using the DXO software.
Signal to noise ratio
A high signal to noise ratio (SNR) indicates a cleaner and better quality image.
Pentax Q: JPEG signal to noise ratio
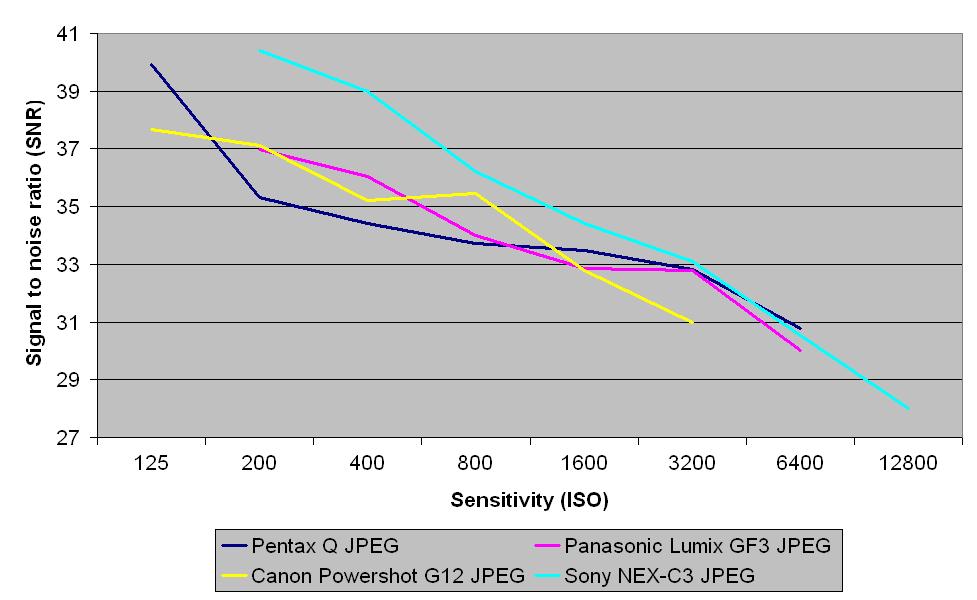
Although the signal to noise ratio of the Pentax Q JPEG images is a little lower between ISO 200 and ISO 800, it is generally on a par with that from the Canon Powershot G12 and Panasonic Lumix GF3
There is little to separate the Q's results from the GF3 and Sony NEX-C3 from ISO 1600 and above.
Pentax Q: Raw file signal to noise ratio
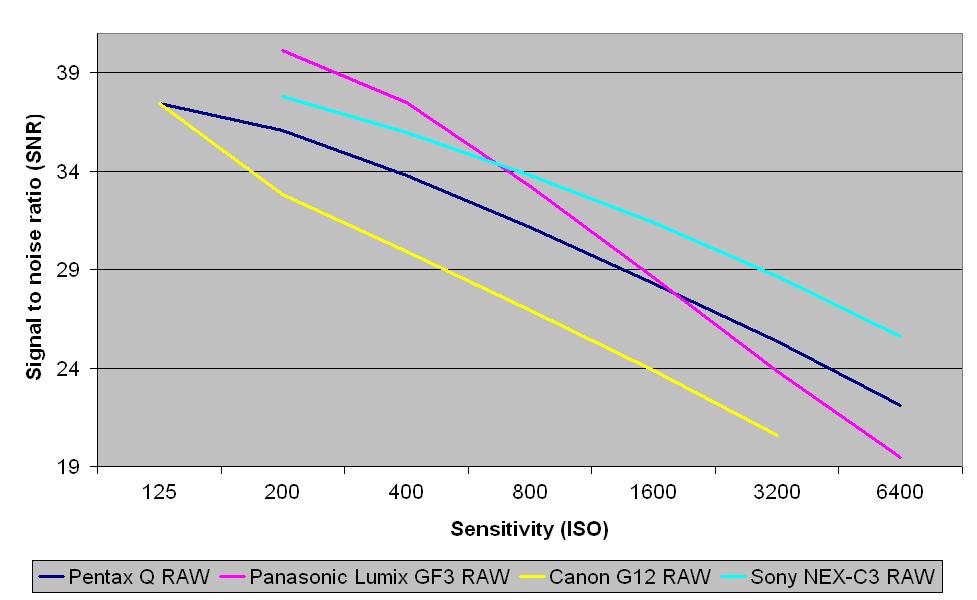
Raw images from the Pentax Q compare well with those from the Canon Powershot G12. The Panasonic Lumix GF3 performs a little better up to around ISO 1600, from which point the Q has a higher signal to noise ratio.
Pentax Q: JPEG Dynamic range
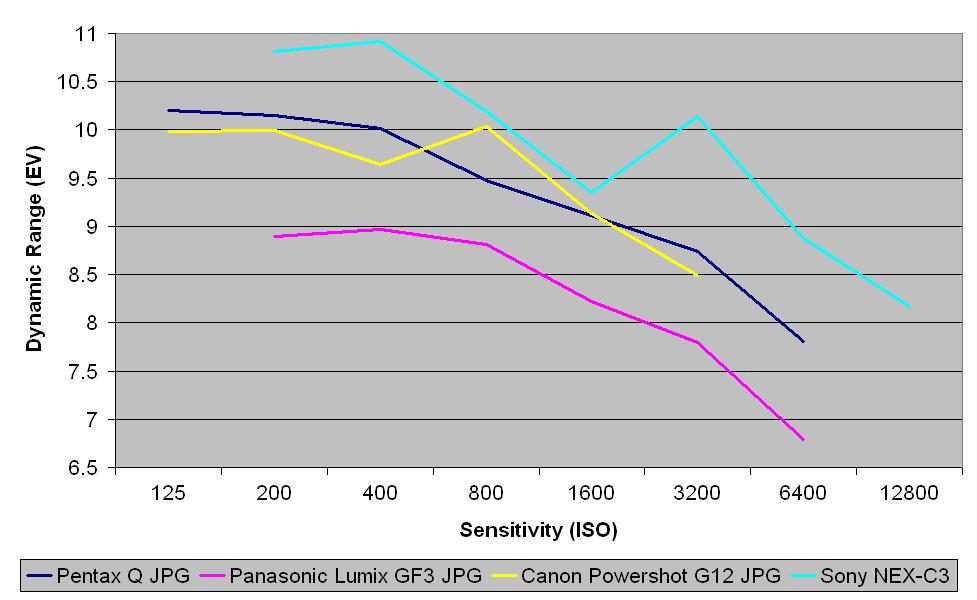
This chart indicates that the Pentax Q's JPEGs have a at least a 1EV higher dynamic range than the Panasonic Lumix GF3 and compare well with the Canon Powershot G12. The Sony NEX-C3 rules the roost though.
Pentax Q: Raw dynamic range
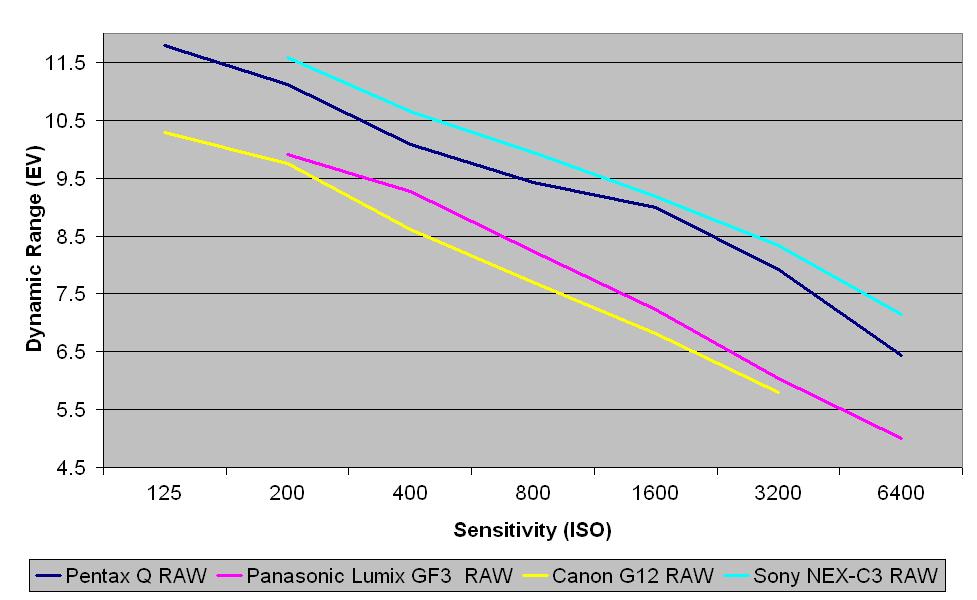
This chart indicates that the Pentax Q's raw files have at least a 1EV higher dynamic range than the Panasonic Lumix GF3 and Canon Powershot G12, and are a pretty close match for the files from the Sony NEX-C3.
Current page: Noise and dynamic range
Prev Page Image quality: Detail resolution Next Page Sample images