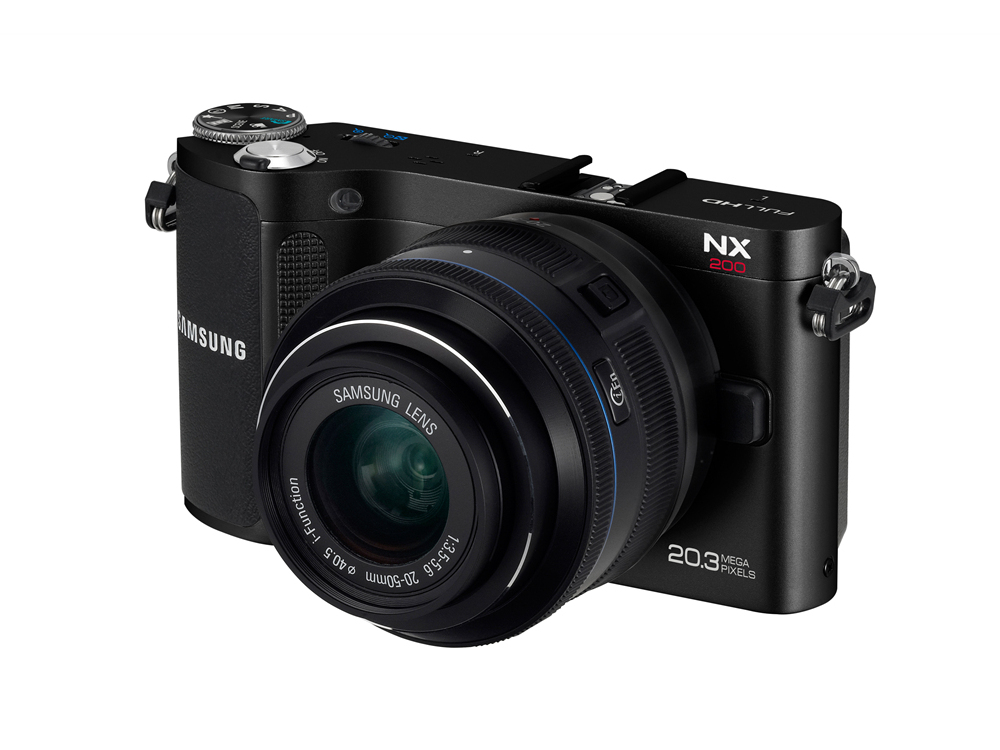
Why you can trust TechRadar
Our results from the lab have been compared against the Olympus E-PL3, Sony NEX-5N and Nikon V1, all available with kit lenses of a similar price.
Our analysis shows that the mix of different sensors in these compact system cameras produces quite different results. While you'd expect the resolution results from the Samsung NX200 to be better than those from the Sony NEX-5N, which also features and APC sized sensor but has fewer pixels, the we found disapointing values from the NX200, for both signal to noise ratio and dynamic range.
Resolution charts
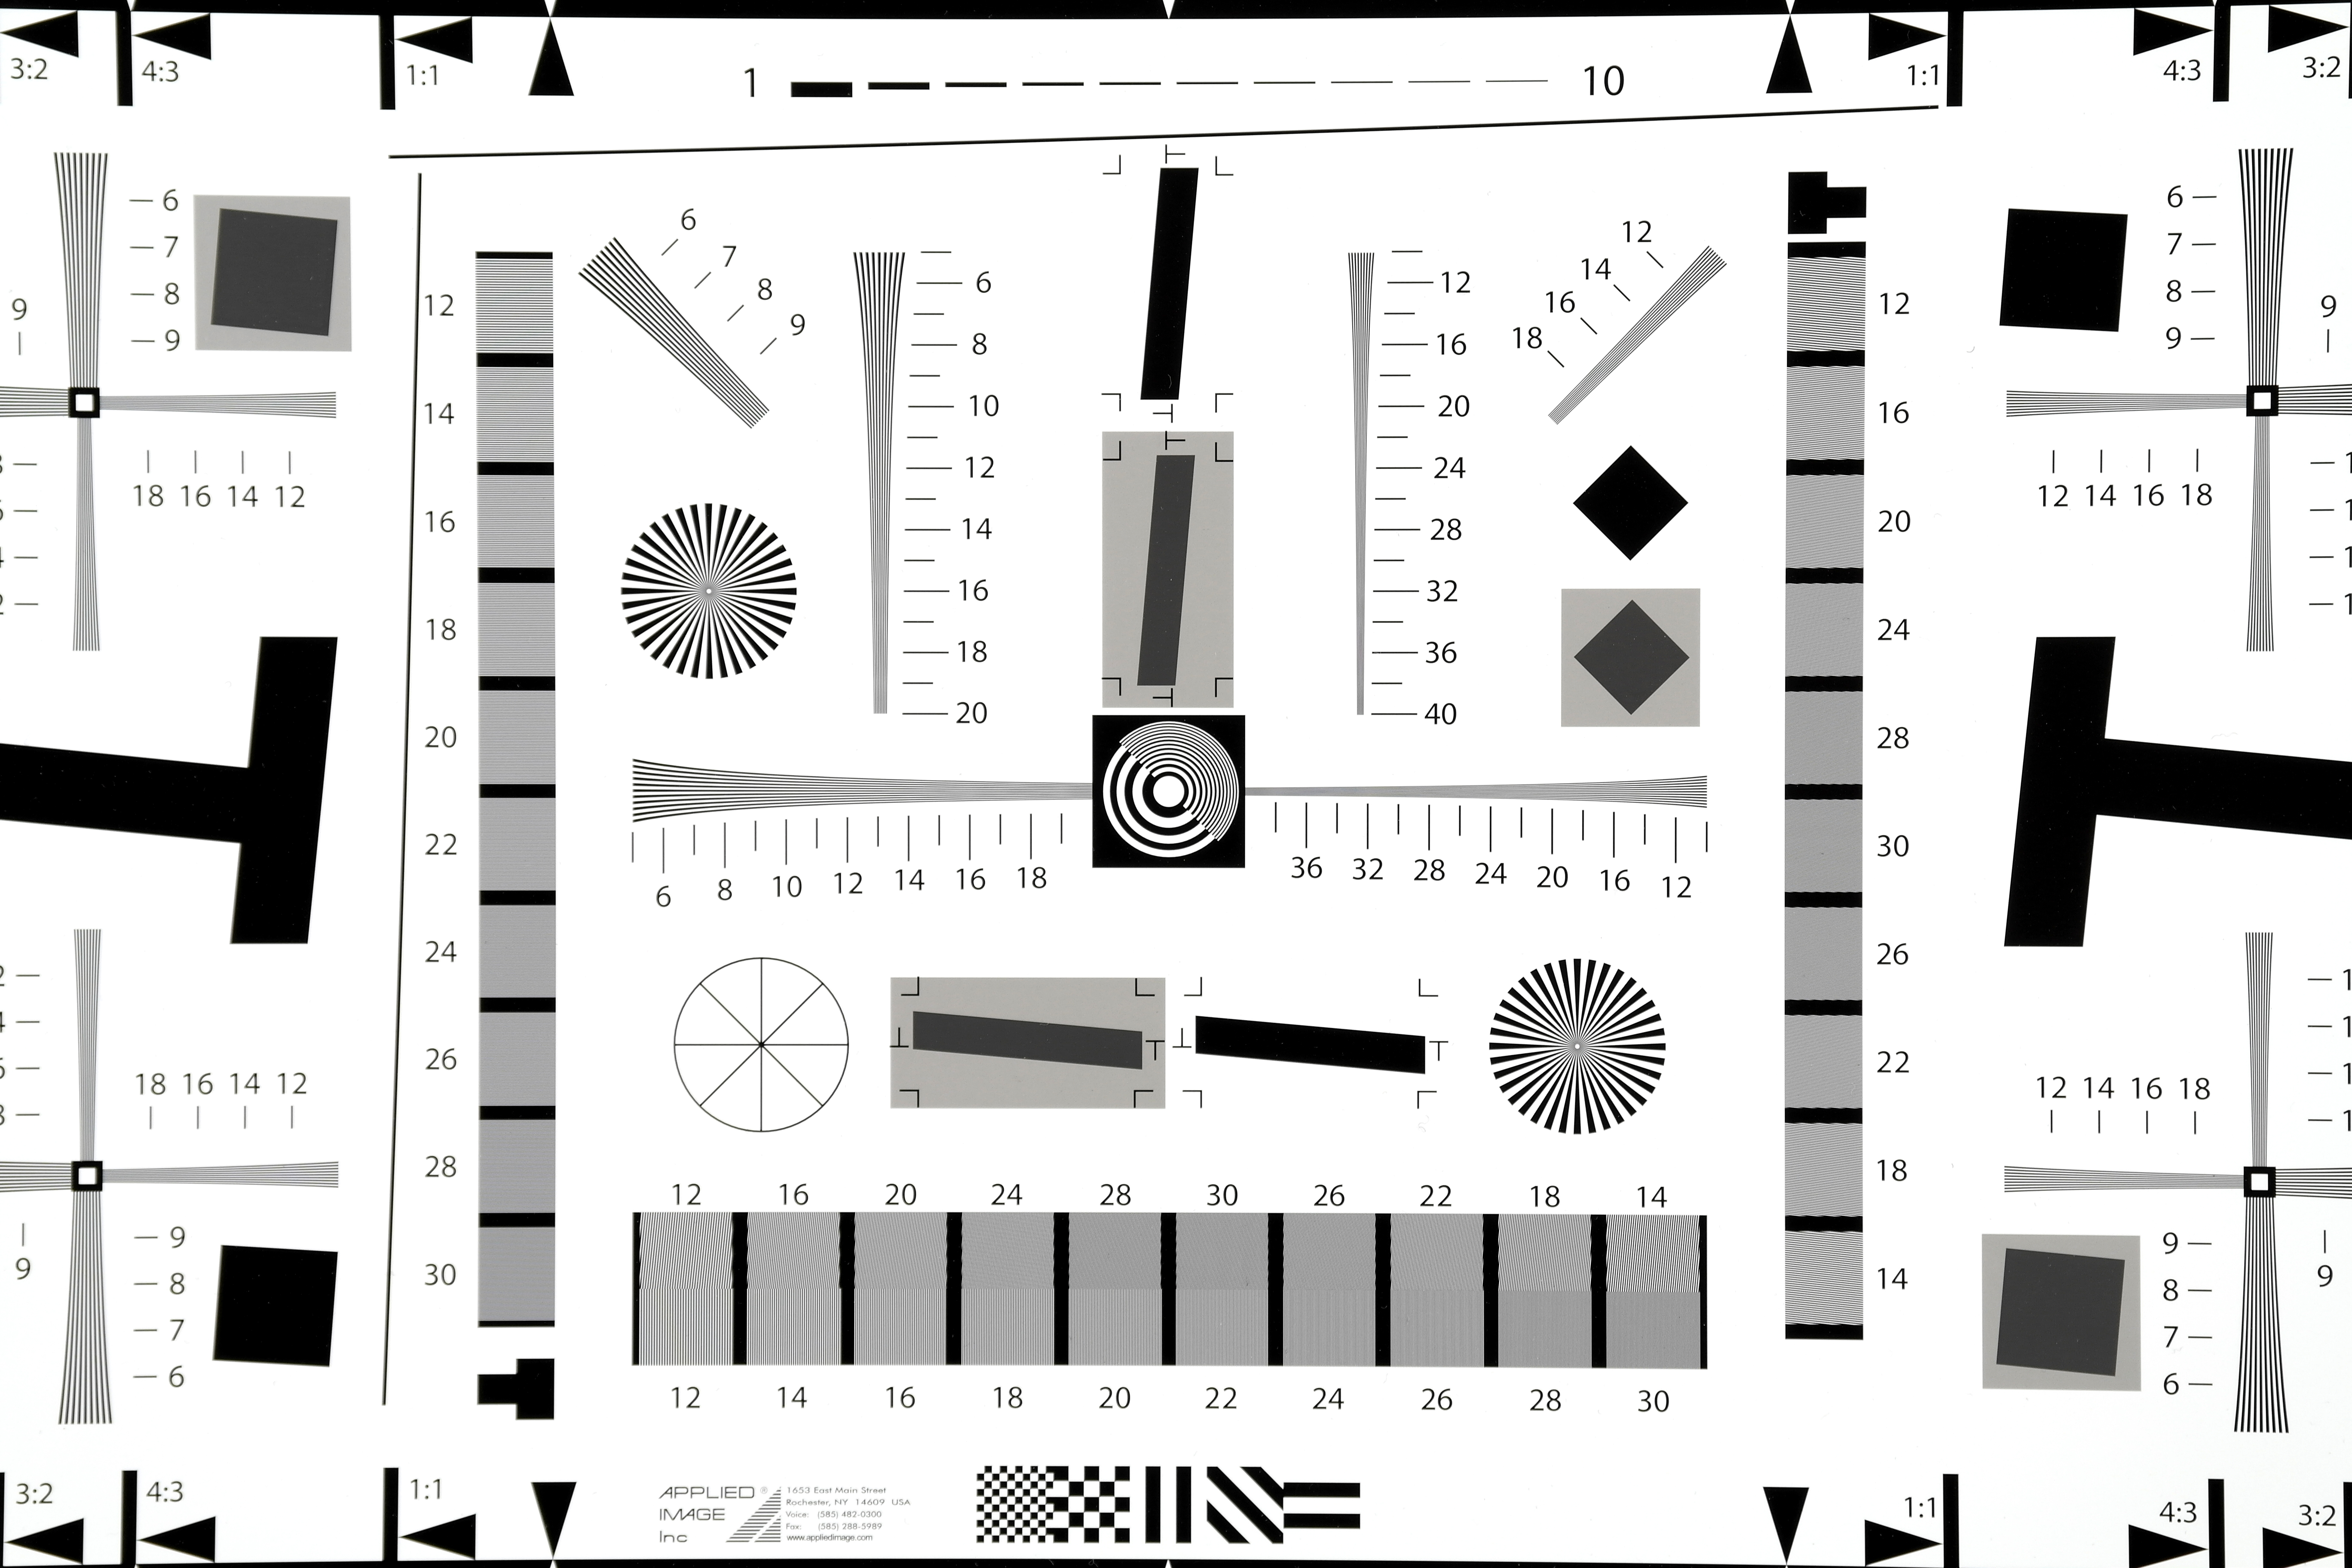
As part of our image quality testing for the Samsung NX200 review, we've shot our resolution chart with the Samsung 18-55mm f/3.5-5.6 ED OIS II lens mounted.
If you view our crops of the resolution chart's central section at 100% (or Actual Pixels) you will see that, for example, at ISO 100 the 26 is capable of resolving up to around 28 (line widths per picture height x100) in its highest quality JPEG files.
For a full explanation of what our resolution charts mean, and how to read them please click here to read the full article.
Examining images of the chart taken at each sensitivity setting reveals the following resolution scores in line widths per picture height x100:
JPEG images
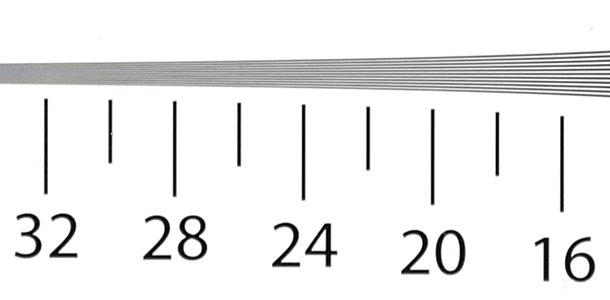
ISO 100, score: 26 (see full image)
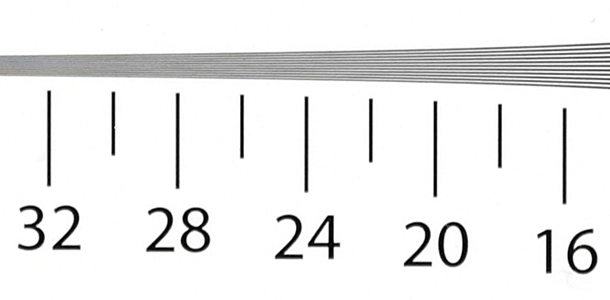
ISO 200, score: 26 (see full image)
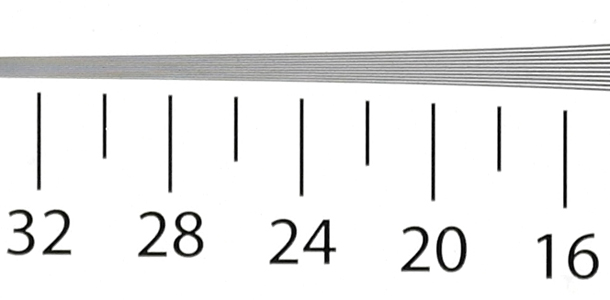
ISO 400, score: 24 (see full image)
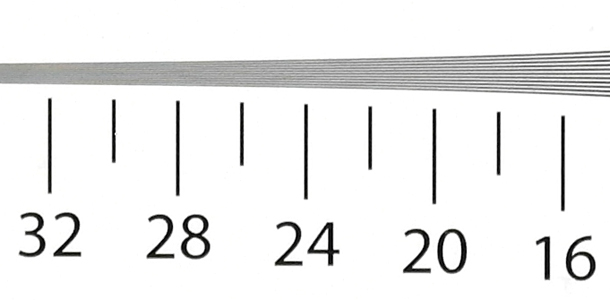
ISO 800, score: 24 (see full image)
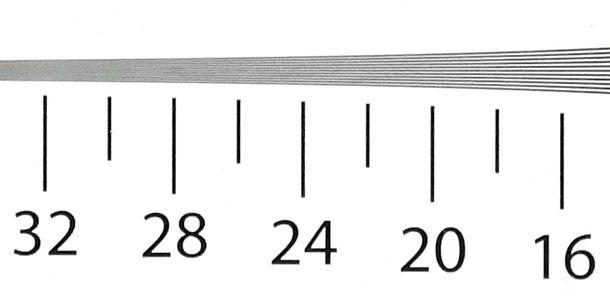
ISO 1600, score: 24 (see full image)
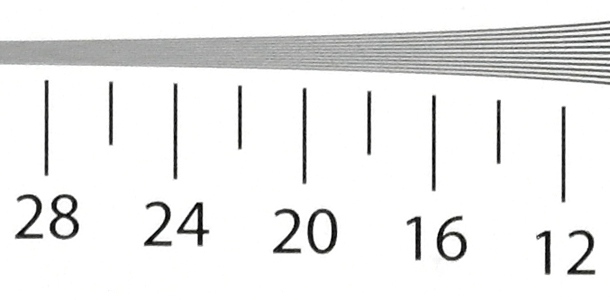
ISO 3200, score: 18 (see full image)
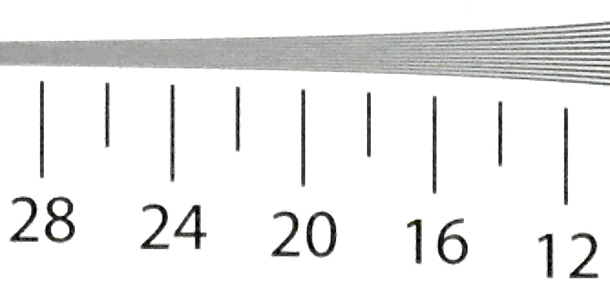
ISO 6400, score: 14 (see full image)
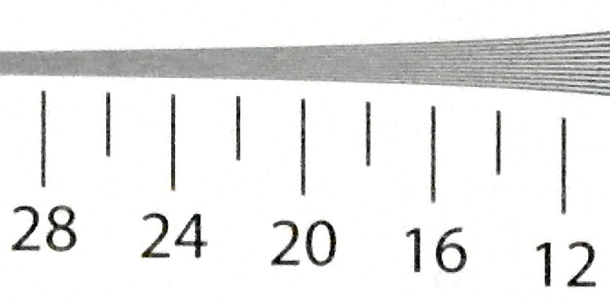
ISO 12800, score: 12 (see full image)
Raw images
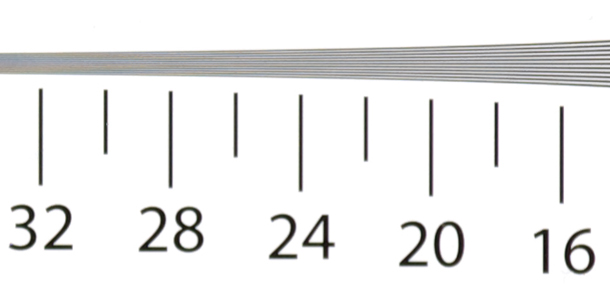
ISO 100, score: 26 (see full image)
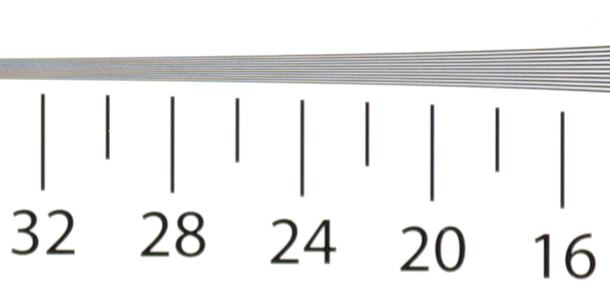
ISO 200, score: 26 (see full image)
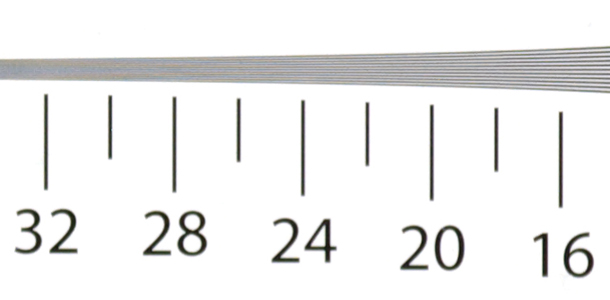
ISO 400, score: 26 (see full image)
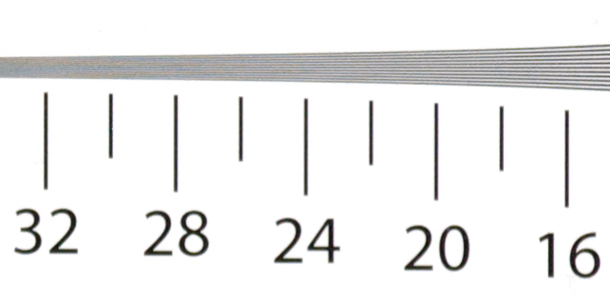
ISO 800, score: 24 (see full image)
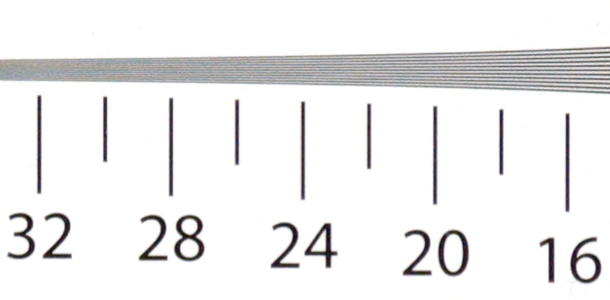
ISO 1600, score: 24 (see full image)
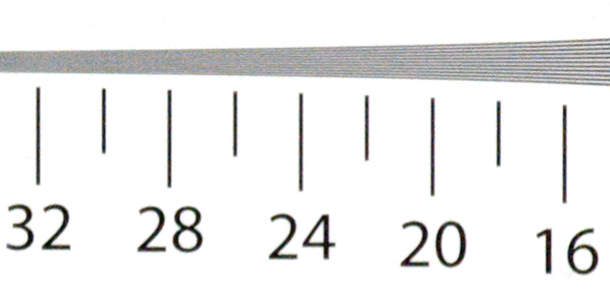
ISO 3200, score: 22 (see full image)
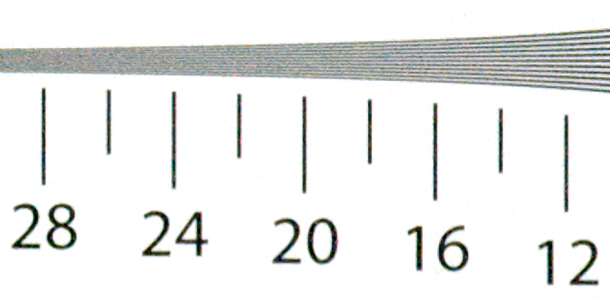
ISO 6400, score: 18 (see full image)
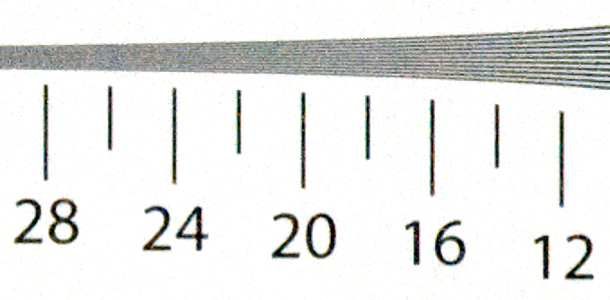
ISO 12800, score: 14 (see full image)
