Why you can trust TechRadar
We shoot a specially designed chart in carefully controlled conditions and the resulting images are analysed using DXO Analyzer software to generate the data to produce the graphs below.
A high signal to noise ratio (SNR) indicates a cleaner and better quality image.
For more more details on how to interpret our test data, check out our full explanation of our noise and dynamic range tests.
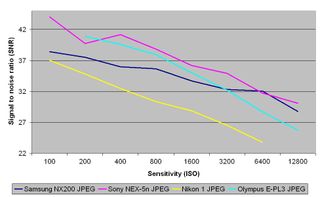
While JPEG images from the Samsung NX200 produce better results than those produced by the smaller sensor of the Nikon V1, up to a sensitivity of ISO 3200 it is out performed by both the Olympus E-PL3 and Sony NEX-5N.
Raw images
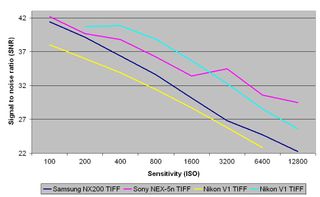
TIFF images (after conversion from raw) from the Samsung NX200 have signal to noise ratio results that are consistently lower than both the Olympus E-PL3 and Sony NEX-5.
Dynamic range
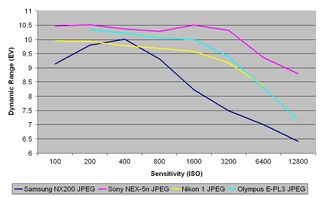
This chart indicates that the Samsung NX200's JPEGs have a lower dynamic range than the Sony NEX-5n and Olympus E-PL3 and only beats the Nikon V1 at a sensitivity of ISO 400.
Raw images
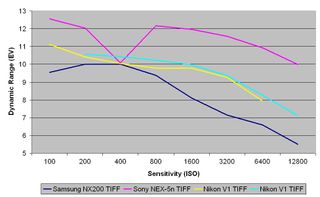
This chart indicates that the Samsung NX200's JPEGs have a consistantly lower dynamic range than the Sony NEX-5n, Olympus E-PL3 and Nikon V1.
Current page: Noise and dynamic range
Prev Page Image quality and resolution Next Page Sample images
OpenAI is giving away ChatGPT Plus subscriptions to students to help you study for finals – here’s how to apply

Tour of Flanders live stream 2025: Watch WorldTour cycling online from anywhere

I didn’t care about Copilot, but this massive upgrade could make Microsoft’s AI the personal assistant I’ve always wanted
