Why you can trust TechRadar
The signal to noise ratio test measures the amount of random noise being produced in the image against the amount of real detail. The higher the figure, the greater the difference – and the less noise you're going to see in your photos. Signal to noise ratio is the scientific way of measuring how noisy images look at different ISO settings.
Signal to noise ratio test

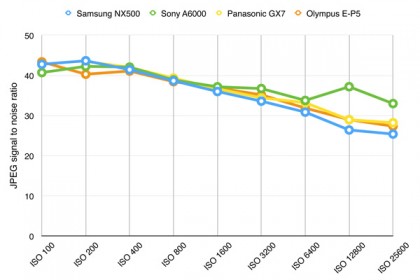
JPEG signal to noise ratio analysis: Having a very high pixel count means that the photo receptors are very small, even on a backside-illuminated sensor, and this makes it harder to control noise than with a lower resolution sensor. Nevertheless, the NX500 puts in a good performance in comparison with the 16MP Panasonic GX7 and Olympus E-P5 and 24MP Sony A6000.

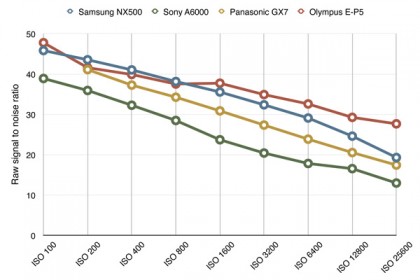
Raw signal to noise ratio analysis: The NX500 produces a strong signal to noise ratio at lower and mid-range sensitivity settings indicating that images are relatively clean, but its performance falls away progressively at higher ISOs. It is, however, almost the best in the group, and a very narrow second to the Olympus E-P5.
Sign up for breaking news, reviews, opinion, top tech deals, and more.
