Why you can trust TechRadar
We shoot a specially designed chart in carefully controlled conditions and the resulting images are analysed using DXO Analyzer software to generate the data to produce the graphs below.
A high signal to noise ratio (SNR) indicates a cleaner and better quality image.
For more more details on how to interpret our test data, check out our full explanation of our noise and dynamic range tests.
Here we compare the Sony NEX-6 with the Panasonic G5, Sony NEX-7 and Olympus E-P3.
JPEG signal to noise ratio
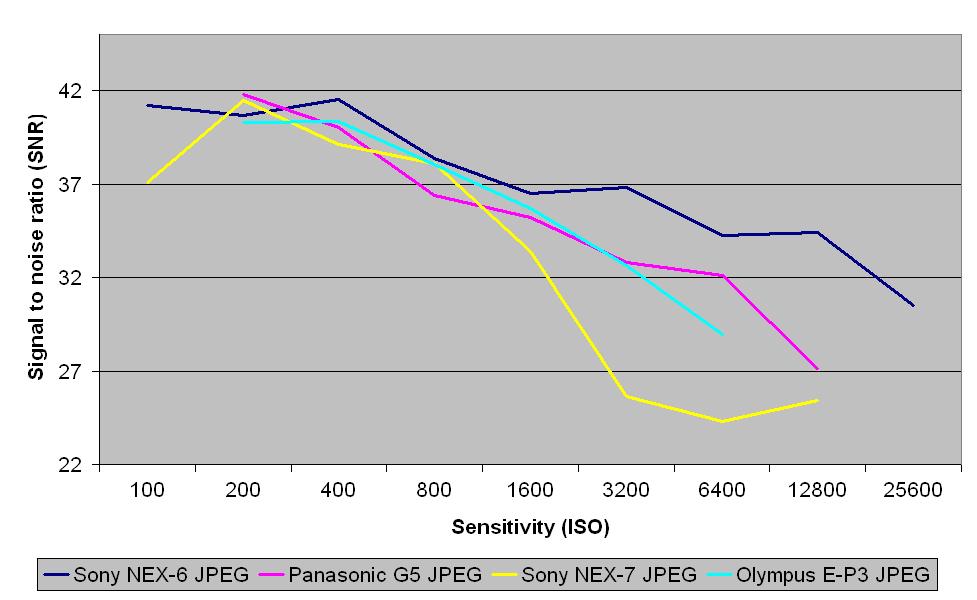
These results show that the Sony NEX-6's JPEG files have a similar signal to noise ratio to those from the Panasonic G5, Sony NEX-7 and Olympus E-P3 at lower to middling sensitivities, but they achieve significantly better results at ISO 1600 and above.
Raw signal to noise ratio
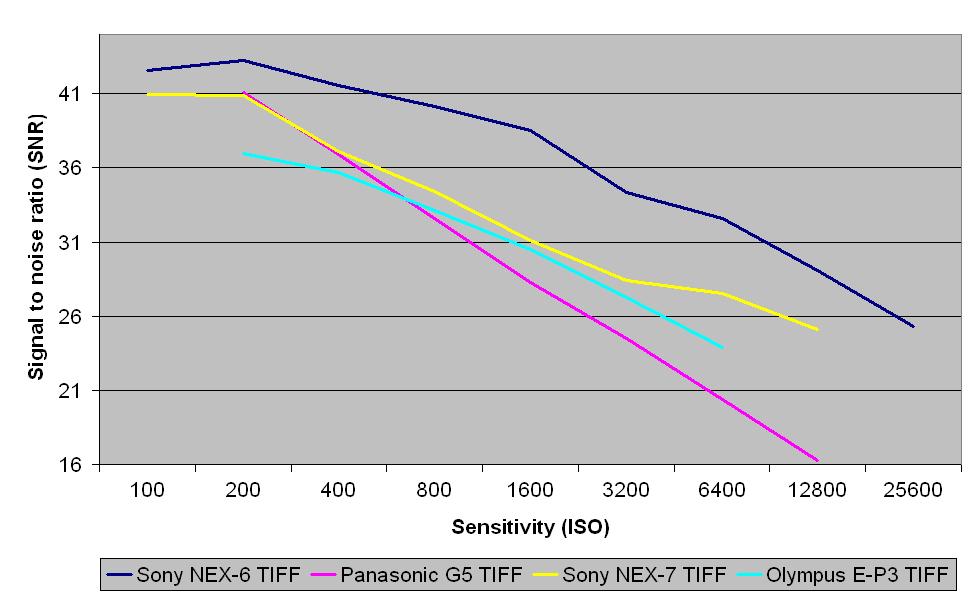
The signal to noise ratios of the TIFF images (after conversion from raw) from the Sony NEX-6 are stronger than those from the other cameras at all sensitivities. The Sony NEX-7 was the next strongest performer, followed by the Olympus E-P3 and Panasonic G5.
JPEG dynamic range
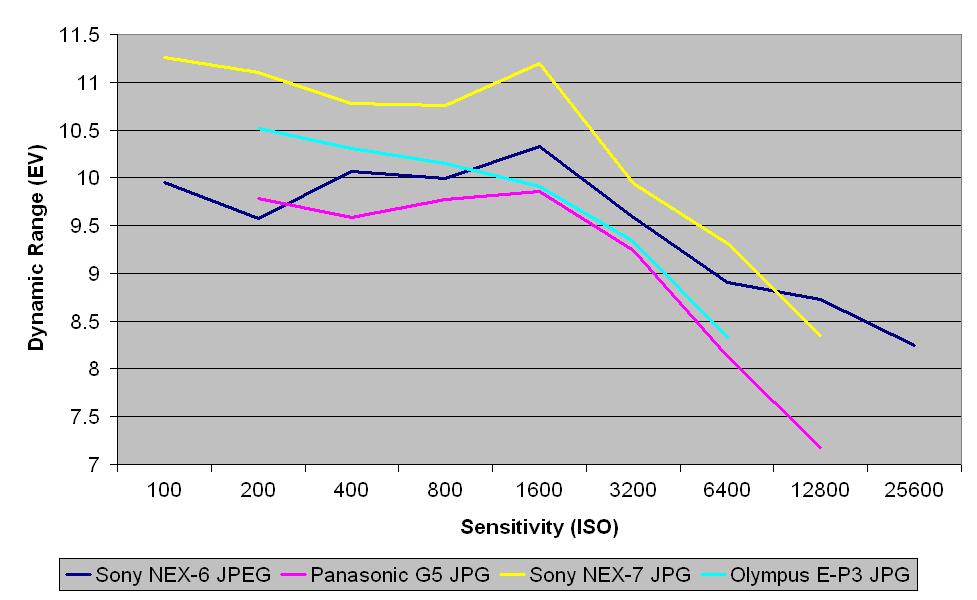
JPEG results for dynamic range less impressive than those for signal to noise ratio, with the Sony NEX-6 producing weaker images than the Sony NEX-7 at all sensitivity settings. It also falls below the Olympus E-P3 at lower ISOs, before overtaking it at ISO 800 and above. Its JPEGs show a greater dynamic range than the Panasonic G5's, except at ISO 200.
Sign up for breaking news, reviews, opinion, top tech deals, and more.
Raw dynamic range
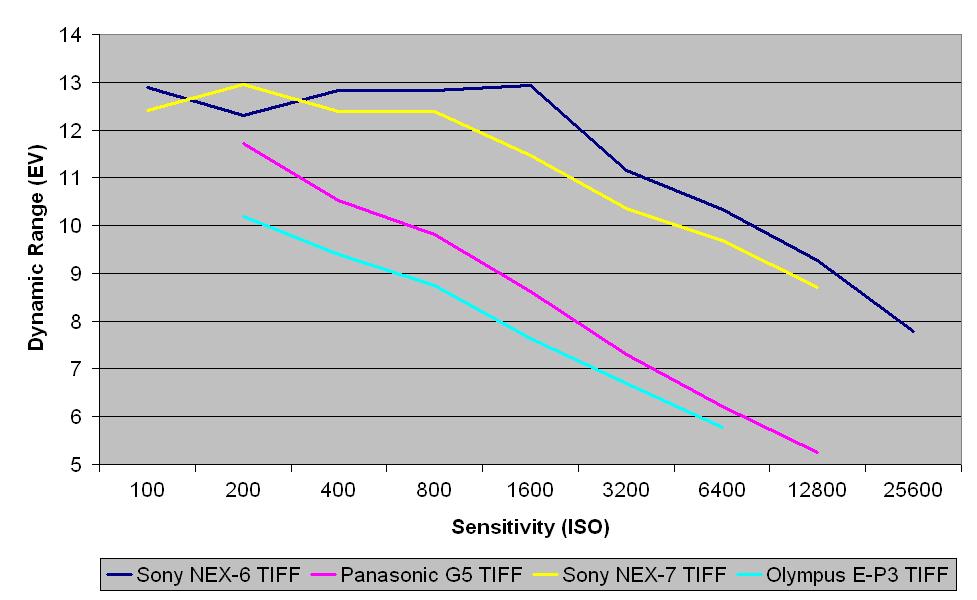
TIFF images (after conversion from raw) from the Sony NEX-6 have a greater comparative dynamic range than the JPEG images did. The Sony NEX-6 beats all of the other cameras throughout the sensitivity range, except at ISO 200, where the Sony NEX-7 produces stronger results. The NEX-7 was the second strongest performer here, followed by the Panasonic G5, then the Olympus E-P3.
Current page: Noise and dynamic range
Prev Page Image quality and resolution Next Page Sample images