Why you can trust TechRadar
We shoot a specially designed chart in carefully controlled conditions and the resulting images are analysed using the DXO Analyzer software to give noise and dynamic range measurements at every sensitivity (ISO) setting.
For more more details on how to interpret our test data, check out our full explanation of our noise and dynamic range tests.
JPEG signal to noise ratio
A high signal to noise ratio (SNR) generally indicates a cleaner and better quality image.
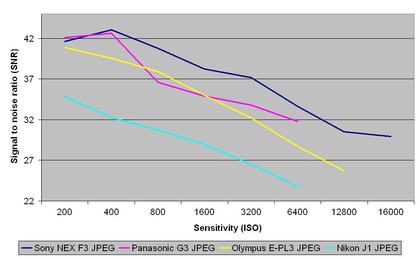
Our lab tests indicate that the Sony NEX-F3 produces JPEG images that have a high signal to noise ratio in comparison with images from the Nikon J1 and Olympus PEN E-PL3. They are closest to the JPEGs from the Panasonic G3, but even this camera has a lower signal to noise ratio overall.
Raw signal to noise ratio
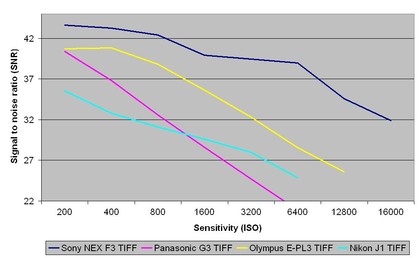
The difference in the signal to noise ratio of the Sony NEX-F3's raw files (after conversion to TIFF) and the other cameras' is much wider than the JPEG files. Although the Olympus PEN E-PL3 has the closest score, they're still pretty different. The Nikon J1 and Panasonic G3 have lower signal-to-noise ratios.
JPEG dynamic range
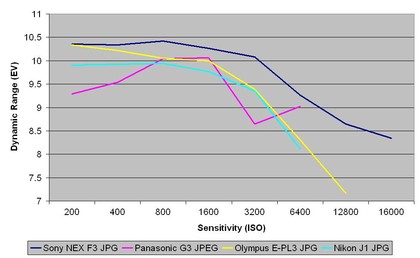
This chart indicates that the dynamic range of the Sony NEX-F3's JPEGs compares well with that of theOlympus PEN E-PL3, Nikon J1 and Panasonic G3. At lower sensitivities, it produces similar results to theOlympus PEN E-PL3, but overtakes it at mid-to-high ISOs.
Raw dynamic range
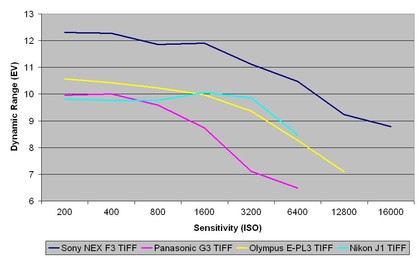
Again, this chart indicates that there is a bigger gap between results for the Sony NEX-F3's raw files than there was for the JPEGs. It compares well against the Olympus PEN E-PL3, Nikon J1 and Panasonic G3, which are clustered closer together. This test shows that the Sony NEX-F3 is capable of capturing a good amount of shadow and highlight detail, with the best results from the lower sensitivities.
Current page: Noise and dynamic range
Prev Page Image quality and resolution Next Page Sample images