Why you can trust TechRadar
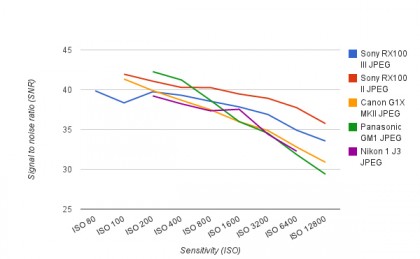
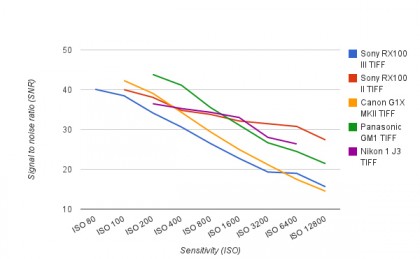
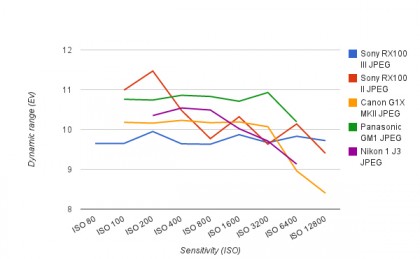
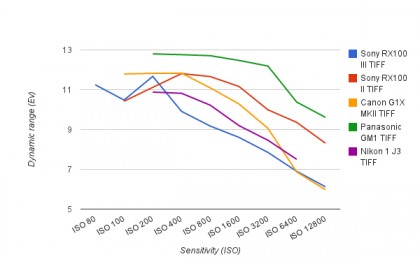
We shoot a specially designed chart in carefully controlled conditions and the resulting images are analysed using DXO Analyzer software to generate the data to produce the graphs below.
A high signal to noise ratio (SNR) indicates a cleaner and better quality image.
For more more details on how to interpret our test data, check out our full explanation of our noise and dynamic range tests.
JPEG signal to noise ratio
Raw signal to noise ratio
JPEG dynamic range
Raw dynamic range
Current page: Noise and dynamic range
Prev Page Build and handling Next Page Sensitivity and noise imagesTOPICS
LATEST ARTICLES
